Overview
The Agents Dashboard enables admins to examine agents’ performance and productivity, as well as expose behavior trends, goal accomplishments, and manipulations of the platform by a specific agent.
Hovering over any matrix will show a detailed explanation and segmentation of the relevant data.
Clicking on any index will enable a deeper dive into the information to investigate agents’ performance, the shift, etc.
This guide explains each section of the board and how to export the data while pointing to relevant examples that can be learned from the presented data.
To access the board, navigate to Insights > Custom BI Dashboards and select the Agents Dashboard from the dropdown menu.
Note that BI Dashboards require specific permissions. Contact us for more information.
Selecting Data
-
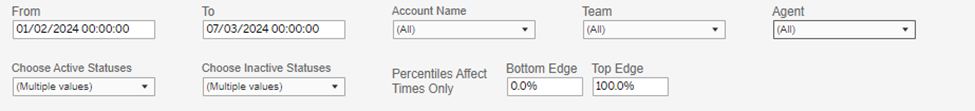
Select the date range of sent templates in the From and To filters.
-
Select the applicable Accounts (brands) or divisions and click Apply.
-
Select specific Teams and/or Agents (optional) for a closer analysis or select All for a general viewpoint.
Note that at the corner is the recorded latest time of available data.
-
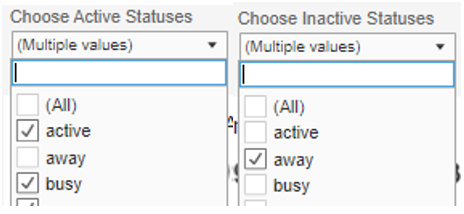
Select the Active and Inactive Statuses in the organization while making sure not to overlap them, and click Apply.
-
To avoid extreme scenarios related to time from skewing the result, you may limit the bottom and top edges (optional).
The Board Components
General Information
To avoid reaching the wrong conclusion, please note the following:
a. The Agent Dashboard relies on the proper use of the Active and Inactive status selection by the agent. Since CommBox does not govern the status name or use, when analyzing the information, consider the organization’s use of the different statuses.
b. The board does not support shifts that cross the dateline. The information presented is always per calendar date.
c. The board does not reflect the teams associated with a specific agent.
d. It is recommended not to include today's date in the analysis. Today’s data is reflected in the tables two hours after the last status change.

Avg. Times reflect the agents’ actual shift (from first to last activity within the system) and how long the selected group was active and inactive.
Suggestion: Sample a few random agents to see when they start and end their shift within the system or whether or not you see data that shows agents are changing statuses based on the organization’s rules.
Avg. Satisfaction rating reflects the selected dates and agents.
First and Second Response records how long it took for an agent to first respond to the customer and how long it took for the agent to respond during an active conversation with the customer.
Suggestion: If data show time that is too slow or too fast then what you know to be the norm, consider limiting the bottom and top end of the data to avoid extreme scenarios.
Shift Efficiency
Avg. Handle Time measures the time from assignment to closure.
Median Handle Time measures the most common scenario of handling time.
Potential Call Average predicts the number of calls that could have been answered during the time the agents were in an Inactive status.
Active / Inactive Statuses
This section expands on the summary provided at the top.
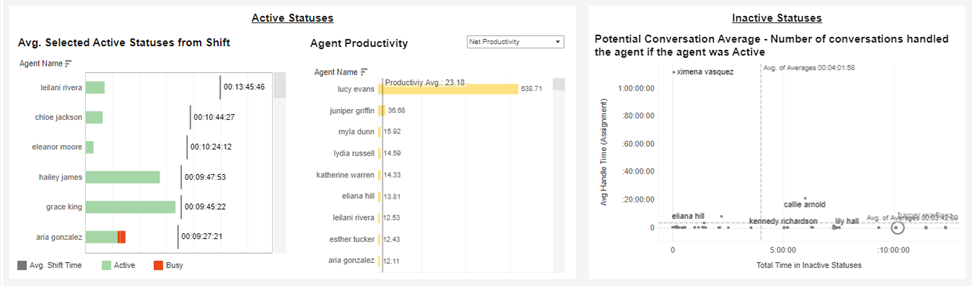
Avg. Selected Active Statuses (from the shift)
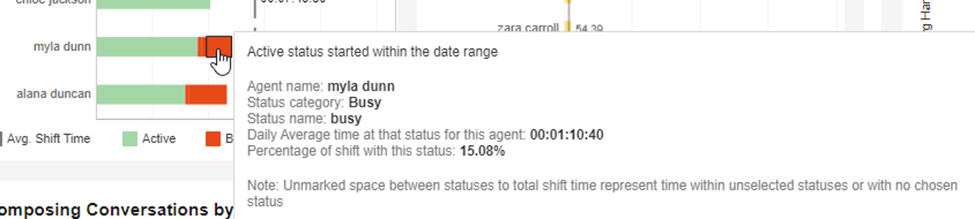
Listing the agent’s name and showing the average time spent in Active/Inactive/no status during the shift. The average shift time is recorded at the end of the line.
Note that you can see the different statuses within the category by hovering on the line.
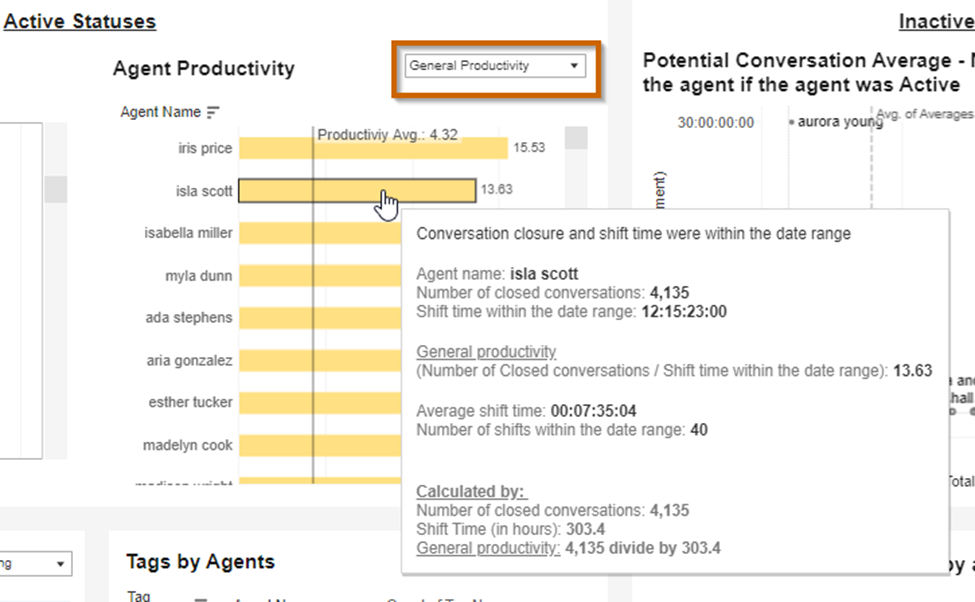
Agent Productivity – General Productivity
This section measures the avg. number of closed conversations each agent accomplished within their average shift. The Productivity Average figure takes all the agents’ averages divided by the sum length of all shifts to show the agents that are above/below that average.
Agent Productivity – Net Productivity
The 2nd option for this section shows how many conversations were closed (daily avg.) during the time the agent was in an Active status.
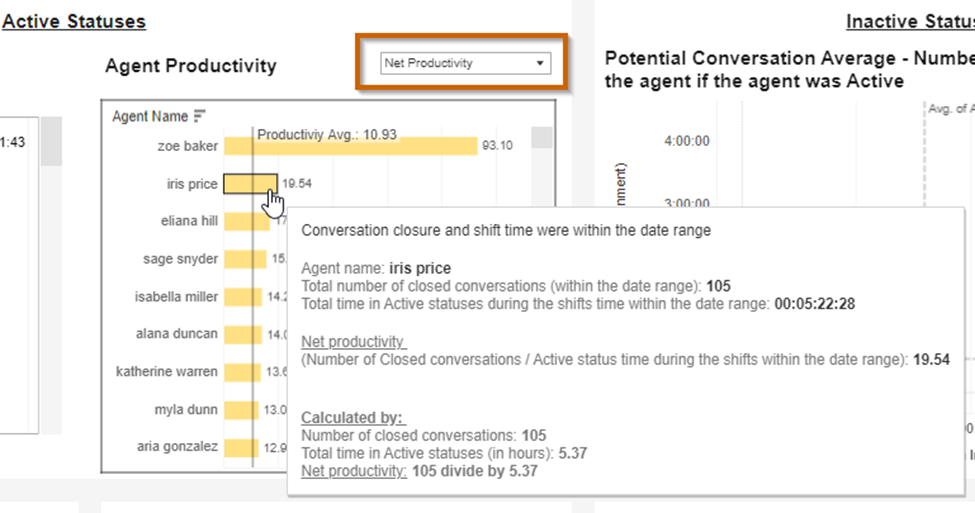
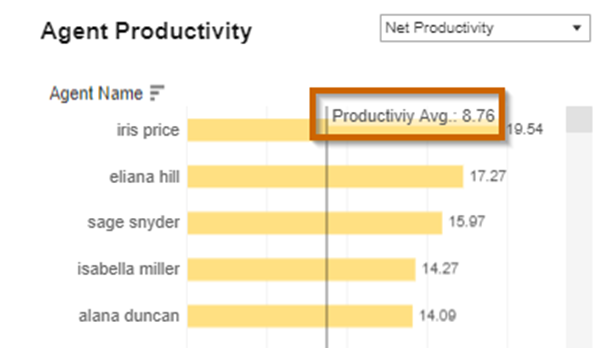
Note that the first agent tallies are very high. Even in a large organization, this is enough to drastically change the productivity average. By removing that agent from the agent list (top of the board), we can see that the average was lowered substantially (from 10.93 to 8.76).
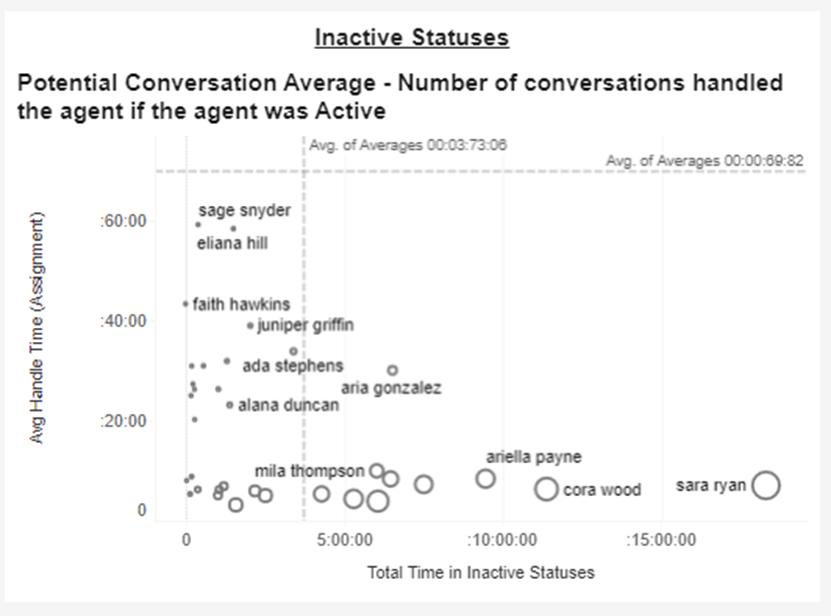
Inactive Statuses
This section describes the lost potential of inactive agents.
The averages of all the agents’ stats are marked with dotted lines, where the vertical line shows the time spent in the inactive status, and the horizontal line shows the average time it takes the agent to close a conversation.
The size of the circle marking shows the relative effect of the loss potential.
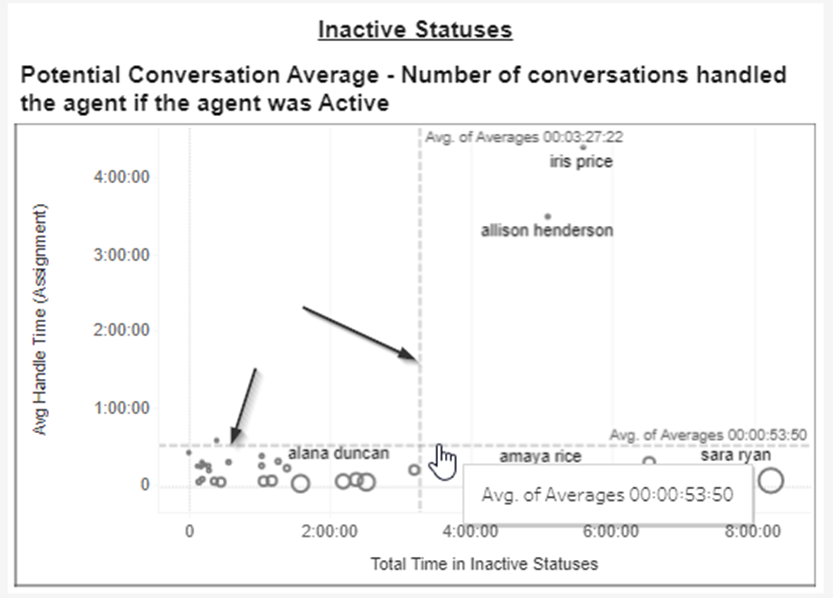
Note that two agents have very high handling time (Maybe they are new employees?). Even in a large organization, this is enough to drastically change the different general averages. By removing those agents from the agent list at the top of the board, we can see more reasonable averages and a better overall picture. We can identify those agents who spend too long as “Inactive”, as well as those who do not change statuses as they should.
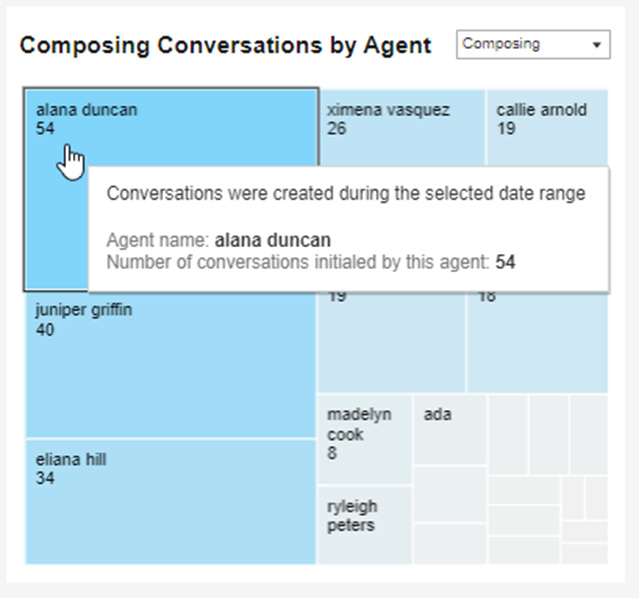
Composing Messages and Template Creation
This section shows the agents with the most outgoing composed messages and created templates using the size of the box as an indicator. The more productive the agent, the darker the color becomes, and the box is positioned towards the top left corner.
Select from the pull-down menu the desired list and hover over the different boxes to see the details. Click on any box to see the list of the actual conversations.
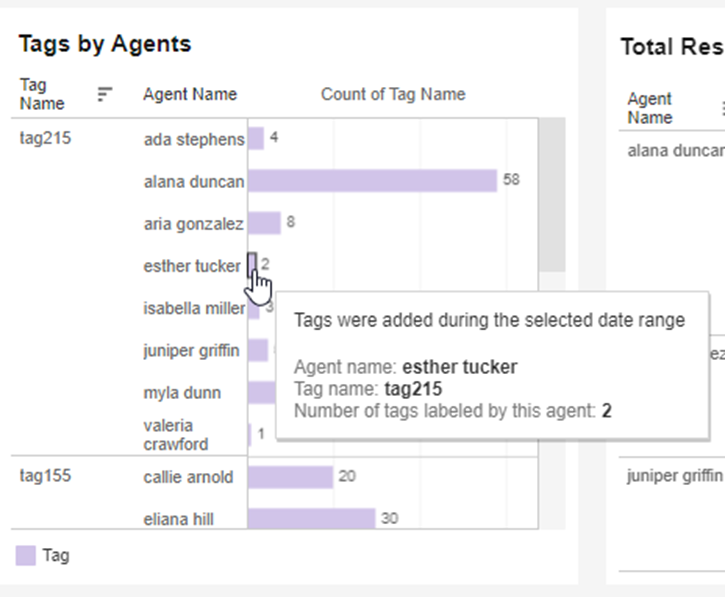
Tags by Agents
This section shows the agent’s usage of different tags. Clicking on the bar will show the details of the related conversations.
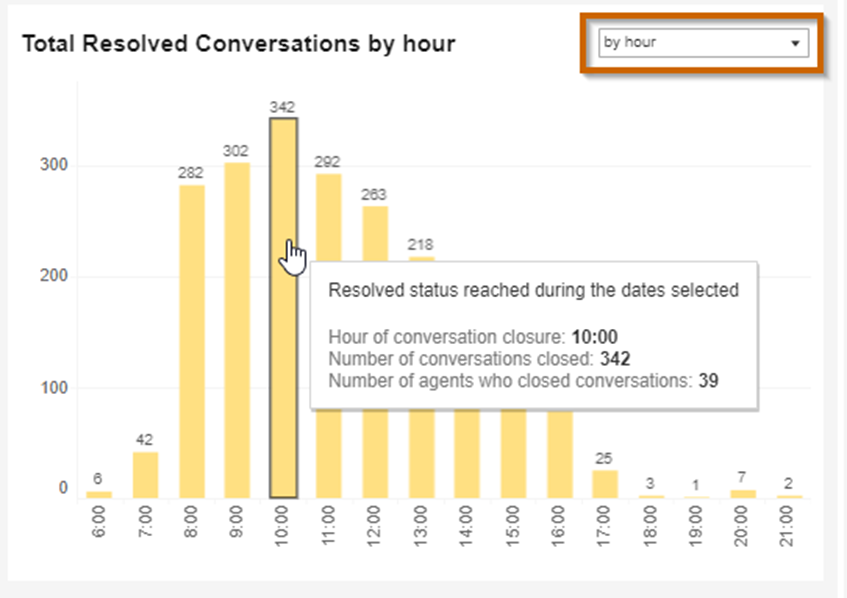
Closed/Resolved Conversations
By Hour
This section shows the time of day by the hour the conversations were closed. Hovering on each bar shows how many agents participated in those closings. Clicking on any bar will show the details of those conversations.
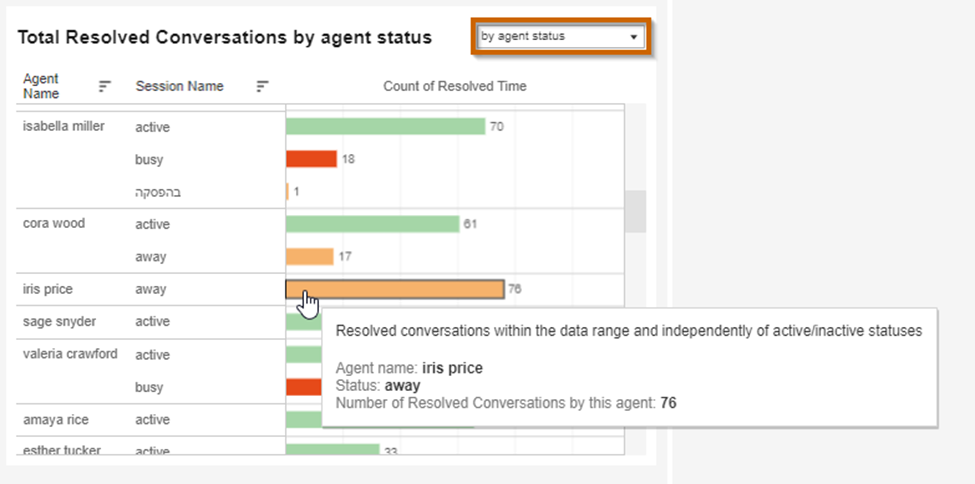
By Agent Status
This section concentrates on the agent’s status at the time the conversation was closed. Note that agent Iris Price is always working while in the Away status. CommBox enables admins and team leaders to create new statuses that may fit your organization and style. Click here to learn more about this topic.
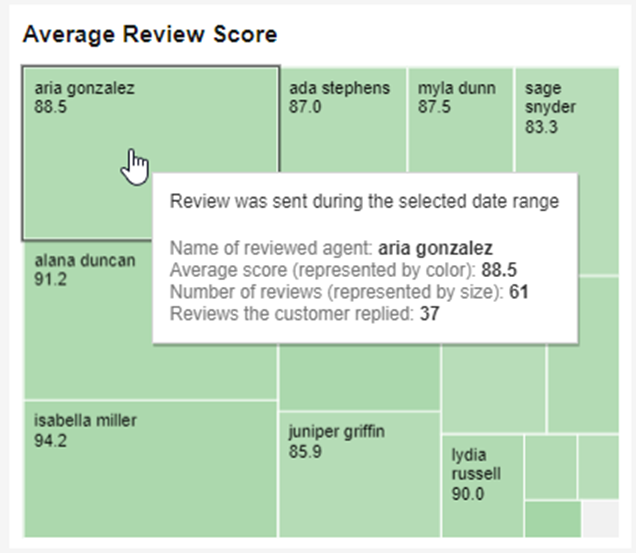
Satisfaction Score (Review Score)
This section shows the agents with the most positive feedback. Each agent is represented in a box showing the average of all reviews, with the shade becoming darker as the number goes up. The size of the box indicates the number of reviews during the selected dates.
In the example below, agent Aria Gonzalez has more reviews (bigger box), but agent Isabella Miller has a stronger shade of green in her box due to the higher score.
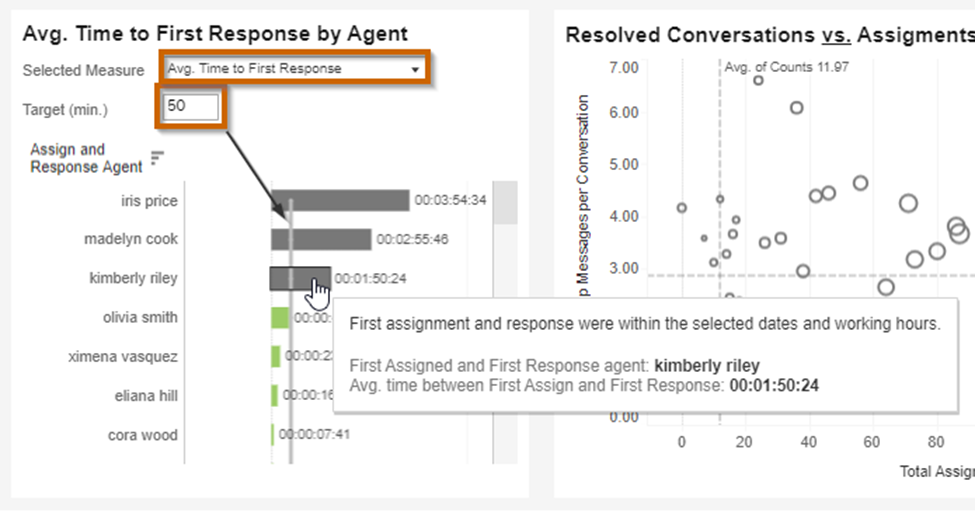
First Response
Avg. Time to First Response by Agent
This section notes how long it took for the agent to first respond to the customer upon assignment.
To help compare between the agents, enter the Target (in minutes) and click Enter. The target bar will reset according to the new target and the agents that missed that target (on average) will have a darker color bar.
Ave Time to Secondary Response
Measure how fast the agents responded within the conversation to the customer’s message.
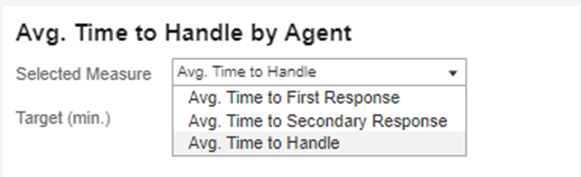
Avg. Time to Handle
Measures how long it took to either resolve the conversation or forward it to another agent.