Overview
The Conversations dashboard is part of the CommBox BI module that enables organizations to view their data with detailed analytics and investigative tools and to dive deep into the layered components that comprise the visual schema. This guide describes the different parts of the board, what can be learned, and how to customize the view to the user’s preferences.
Note: You can create new KPIs and Dashboards by clicking the Managed Dashboard button at the top (special permissions are required). Learn more about this topic in the BI Implementors article. Contact us if you would like to customize the KPIs and the Dashboard according to your organization's requirements and needs.
To access the board, navigate to Insights  > Custom BI Dashboards and select Conversation Dashboard from the dropdown menu.
Selecting Data
The data filters at the top of the dashboard enable users to display relevant information for their investigative purposes.
As a default, the board presents the last seven days of data. You can change, limit, or expand that range at the top left filters.
If desired, you can limit further the data presented based on who started the conversation and the communication channels in which the conversation started or ended.
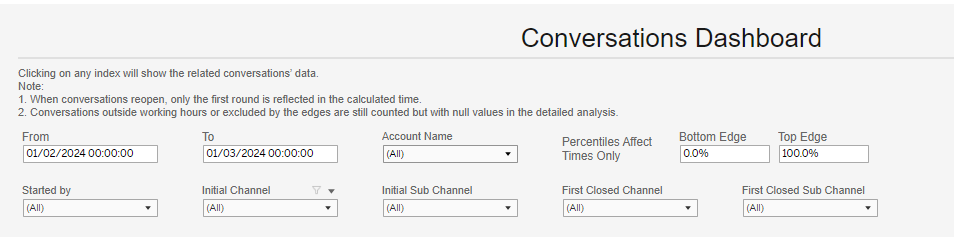
Bottom/Top Edges
Segmentation of the data enables users to understand better what is being investigated by preventing some of the data from overshadowing the relevant data or skewing the averages.
To ignore the Bottom Edge of the data, enter a decimal fraction to indicate when to start including the data. For example, entering .15 and clicking Enter will mean the lower 15% of the data will be ignored. To ignore the upper extreme of the data, enter a decimal fraction at the Top Edge, and click Enter. For example, enter .95 and click Enter to ignore the top 5% of the data.
Data analysis using the bottom and top edges:
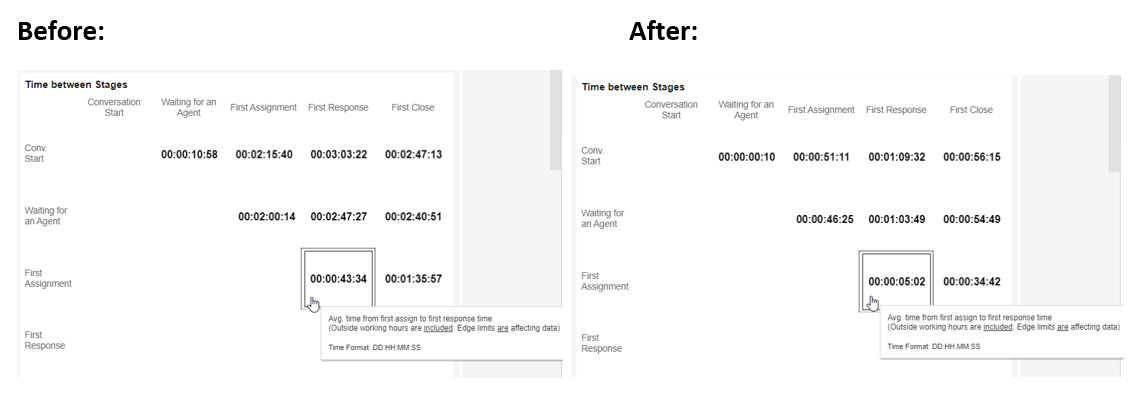
Example A:
As team leaders, we would like to see how long it typically takes for a conversation to reach an agent after an assignment.
When all conversations are included, the data below shows an average of over 43 minutes. This may consist of very few conversations with abnormally long First Response times. We can cut the top 10% of the conversations by setting the top edge to .9 (90%) and clicking Enter.
Once we take those conversations out of the tally, the typical time from First Assign to First Response is about 5 minutes.
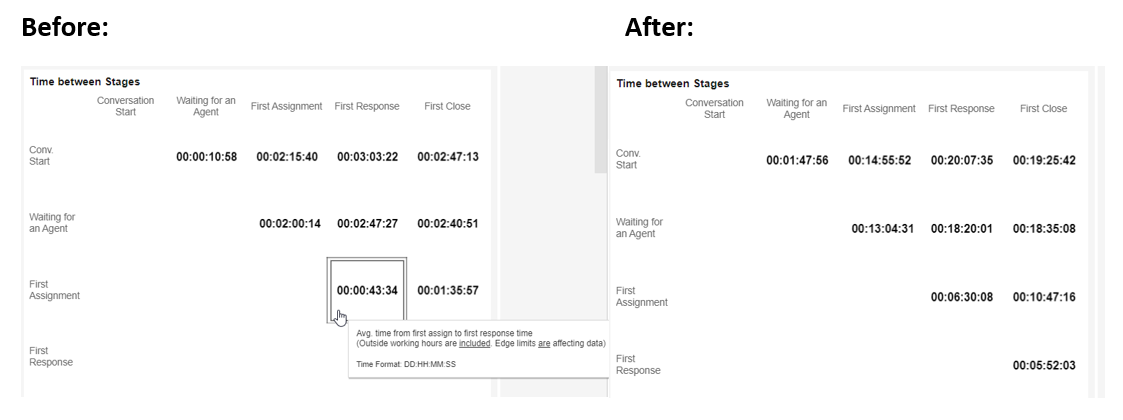
Example B:
Let us investigate those very long conversations.
This time, we will set the bottom edge to .9 (90%) and click Enter (while keeping the top edge at 100%). Our data now concentrates just on the most extended 10%.
Notice that the time from First Assign to First Response is 6 hours longer. We can also notice the time leading up to First Assign is 18 hours on average!
We can see all relevant conversions and why it took so long by clicking on this index. Possible reasons can be e-mail or any other asynchronous communication channel, a conversation started by a bot with a customer slow to respond, or a problem within the system.
Working hours
When hovering over any index, the tooltip indicates:
a) Whether or not conversations outside working hours are included in the figure presented.
b) Whether or not the bottom/top edges of the data are reflected in the presented data.

Conversation Life Cycle
This index shows the step-by-step progression of the conversations.
On the left side, the Averages are presented. The center figure presents the total conversation and the diagram on the left presents the daily breakdown for the selected days.
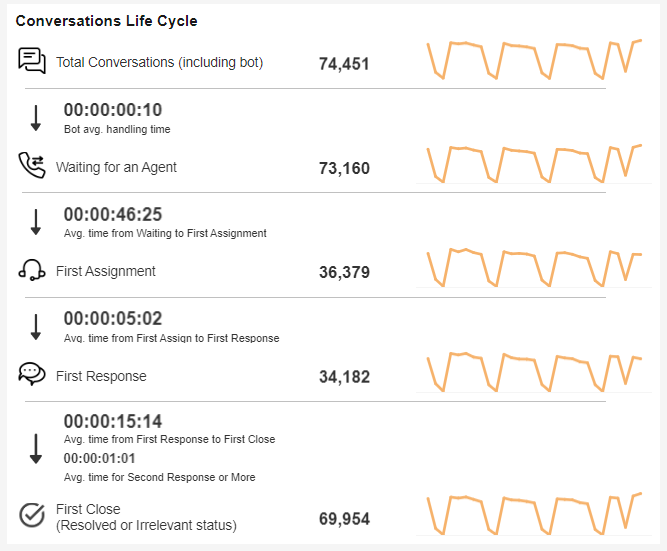
Note:
Averages only reflect conversations during working hours and only those included in the edges filter.
Totals include ALL conversations, including those outside working hours and those limited by the edges filter.
Secondary Response (the last average) measures the time it took the agent to respond to the customer’s last message.
Time Between Stages
This index breaks down the conversations’ components to show the time between each step.
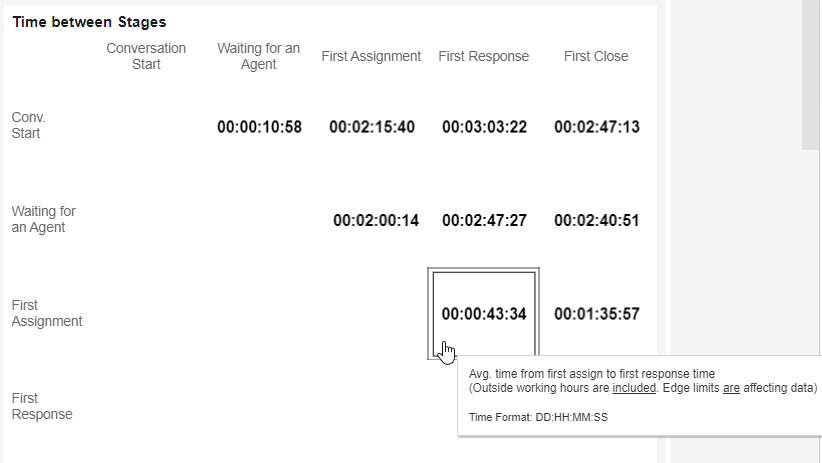
Note: Averages only reflect conversations during working hours and only those included in the edges filter.
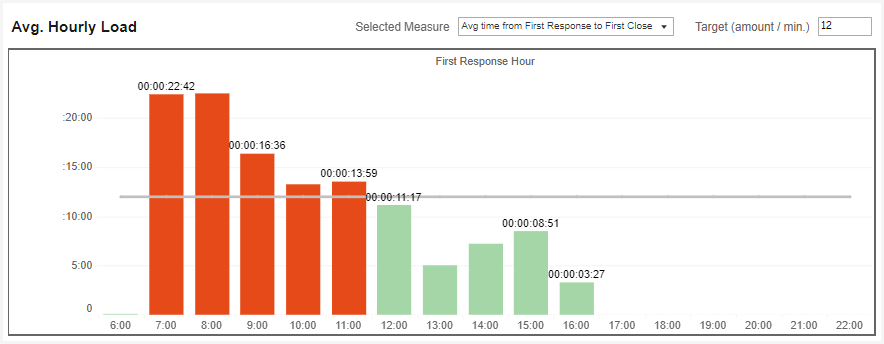
Average Hourly Load
This index breaks down the following components into hourly loads.
The index has a target bar to help see the times that met the target (in green) and those that did not (in red).
Selected measures include the following:
a. The total number of conversations in the investigated period.
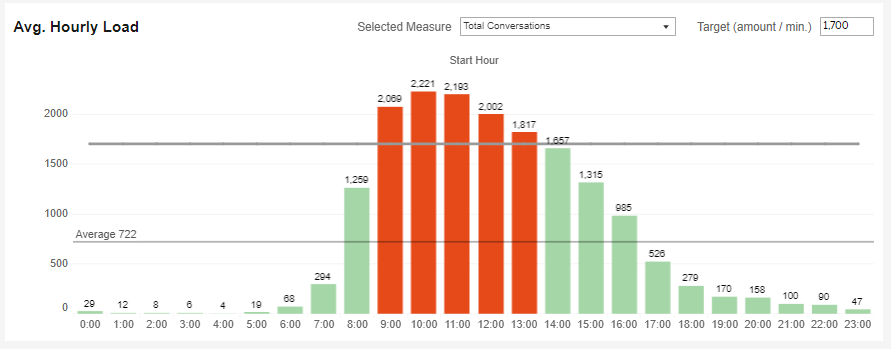
b. The average time from the conversation’s creation to Open status.
c. The average time from Open status to First Assign status.
d. The average time from Open status to First Response status
e. The average time from First Assign status to First Response status.
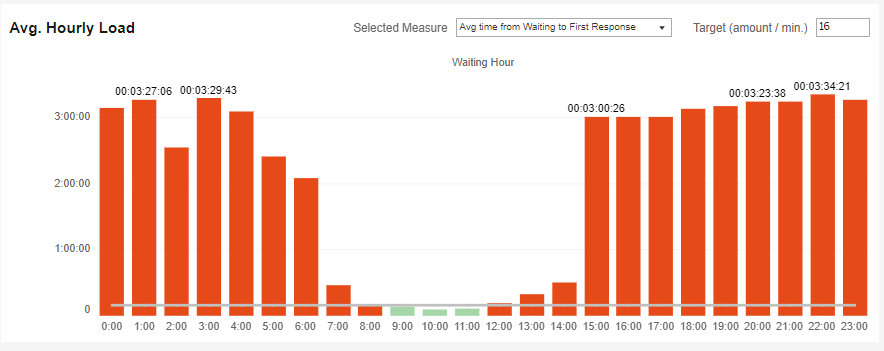
f. The average time from First Response status to First Close status.
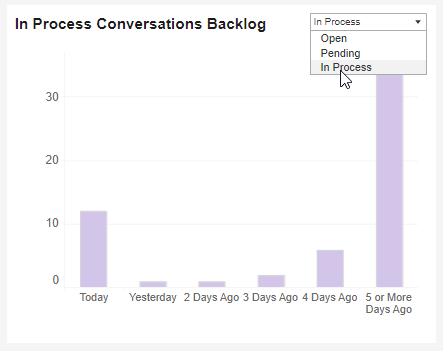
Open Conversations Backlog
This index indicates how long ago the currently open conversations started, how long is the conversation Pending, and being dealt with.
Tagged Conversations
This index displays the most commonly used tags in a visual breakdown.
Filters can limit the tags shown by their group name, type (as classified by the organization), and by who added the tag to the conversation (the bot, agent, or both).
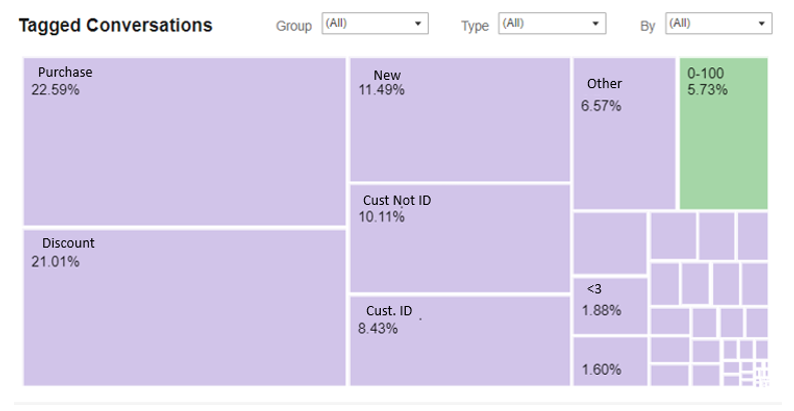
Note:
-
Percentage reflects only tagged conversations. Conversations that were not tagged will not be reflected in the percentages.
-
When selecting some of the tags via any of the filters, the percentages shown reflect just the selected tags.
-
Conversations are counted for each tag separately so that if a conversation has three tags, for example, it will be counted three times in the tally of tagged conversations.
-
When clicking on a tag, the listed conversations may have more than just that tag.
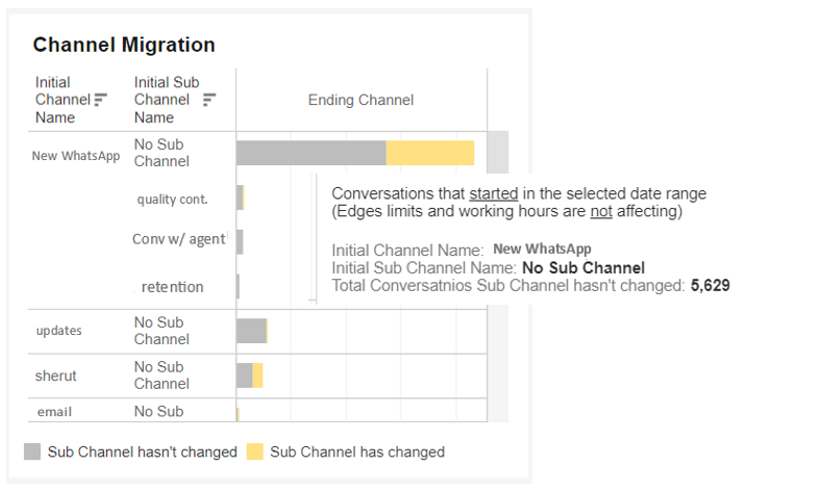
Channels Migration
This index shows how many converstions started in each channel and whether or not they stayed within the initial communication channel.
The initial main channel and subchannels are listed on the left, and the indicated number of relevant conversations that stayed within those channels or transferred to different channels are represented on the right.
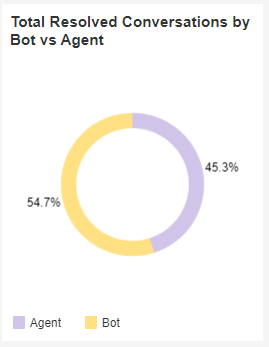
Total Resolved Conversations by Bot vs. Agent
This section measures the total number of conversations that were closed by an agent vs a bot, as a percentage of the total.
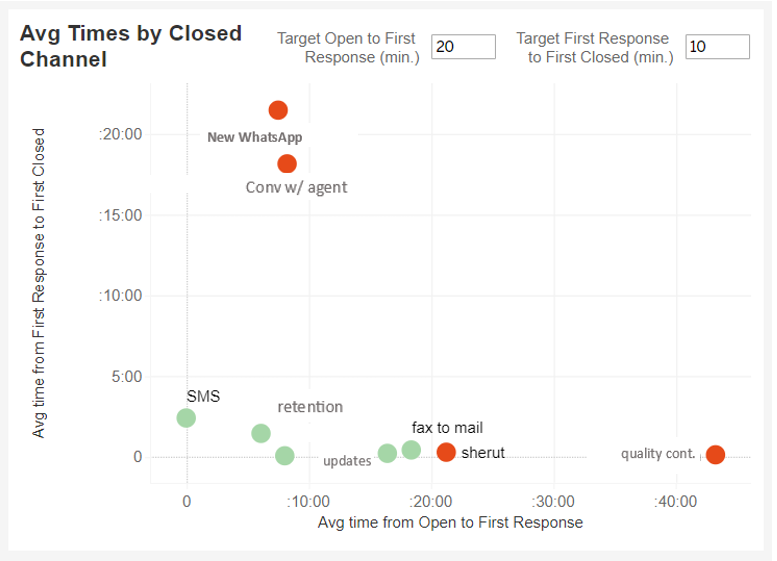
Average Time in the Closing Channel
This index shows the channels where the conversations were closed. Graph positions reflect the time from Open to First Response status vs. the First Response status to the First Closed status. The closer the closing channel data is to the point of origin, the better.
Use the two target lines to help with the visualization.
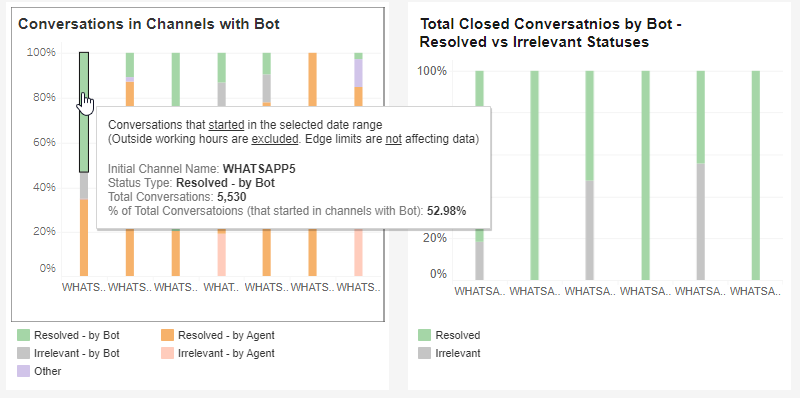
Bot Conversations
These indexes compare the statuses in channels with bot conversations. The population includes all conversations that started in channels with a bot.
Exporting Data
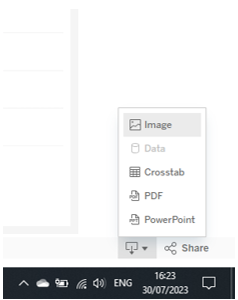
To export the information displayed, navigate to the bottom right corner of the report, click on the download button  , and select the format for exporting.
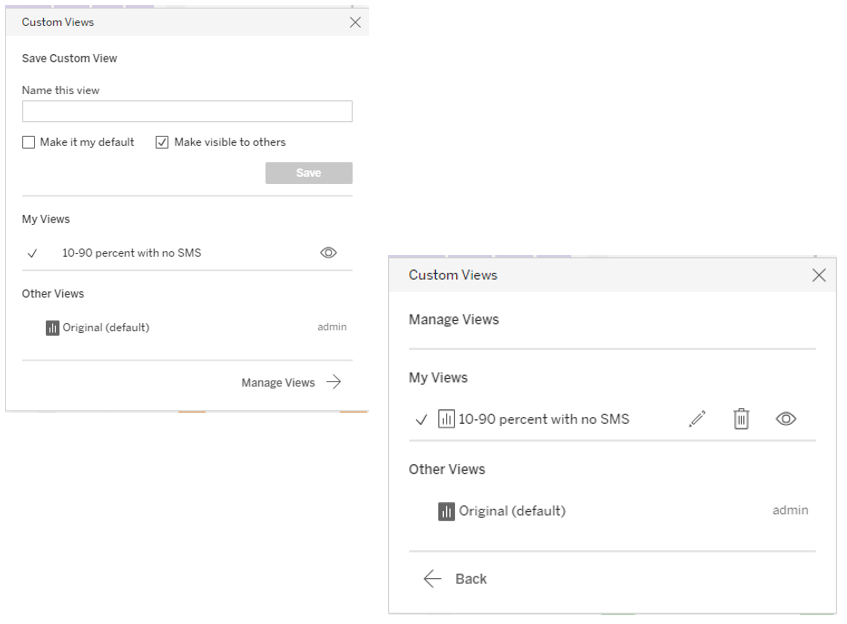
Saving Dashboards
To save the filtering choices and have them displayed when opening the Conversations Dashboard in the future, navigate to the bottom of the report, and click the viewing button. 
At the new dialog box, enter a name for the dashboard and click Save. You may choose to make this dashboard’s filtrations your default view and allow others with permission to view it.
Click Manage Views to edit or delete the different dashboards.