Overview
BI Implementors can use CommBox BI to create new KPIs and dashboards to gain valuable insights from their data about the organization. These dashboards can give insight into agent performance, operational trends, productivity, or any other aspect of the business. For this advanced knowledge base, CommBox is using Tableau and its BI capabilities to transform raw data into visual presentations.
Prerequisites
- To create new KPIs and Dashboards, users need to be classified as “Explorers” in the Tableau platform.
- To view the information, appropriate permissions are required in CommBox, as well as a valid “Viewers” status in Tableau.
- The Tableau system is case-sensitive and can only work with lowercase letters. Email used for login into Commbox must contain only lowercase letters.
Common Terms
Every two specific criteria or categories can create a Key Performance Indicator (KPI) to be displayed as a Datasheet (graph or table). A few of these graphs/tables combine into a Dashboard available for analysis by individuals or groups with granted permissions.
In this guide, we will use commonly found criteria to demonstrate how to use the CommBox BI powered by the Tableau system.
Creating a New Datasheet (KPI)
-
At the Tableau home page, navigate to Personal Space at the left pane, and click Create Workbook at the center. This Workbook (folder) will house the worksheets (KPIs) and Dashboard.
-
Select the Data Source you would like to use and click Connect.
Note: Each of the component names can change and not necessarily reflects the titles of the data presented elsewhere. -
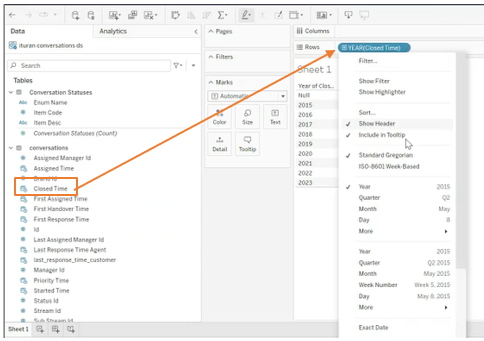
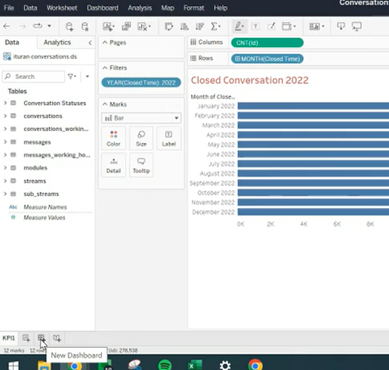
At the left pane, select a component of the data you would like to connect to another and drag it to the row or columns section. For example, we want to display the Closed Time of conversation. After placing it in the Row section, we can click on it to choose how we want this information to be displayed.
-
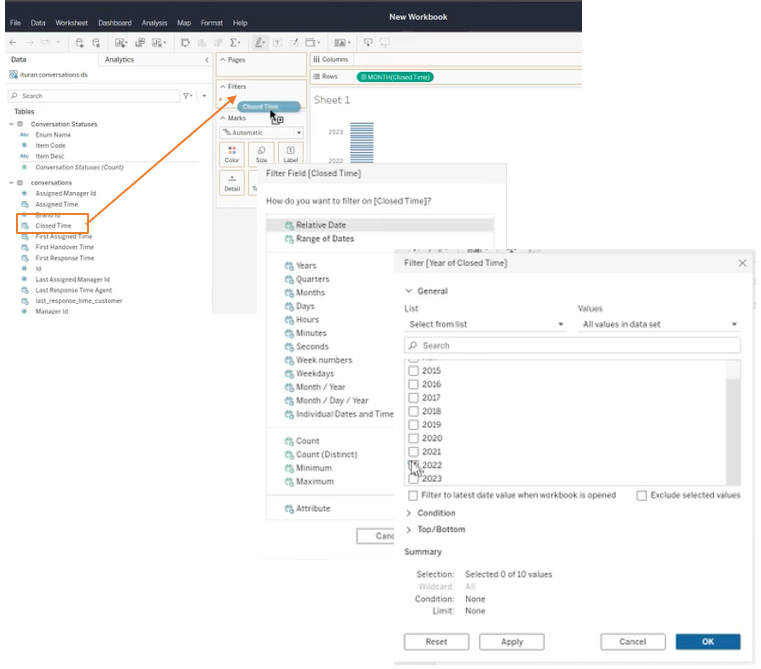
Drag the same component you used to the Filters box to zero in on a smaller time frame from the entire organizational data that is presented. In our example, I want to display only the year 2022.
-
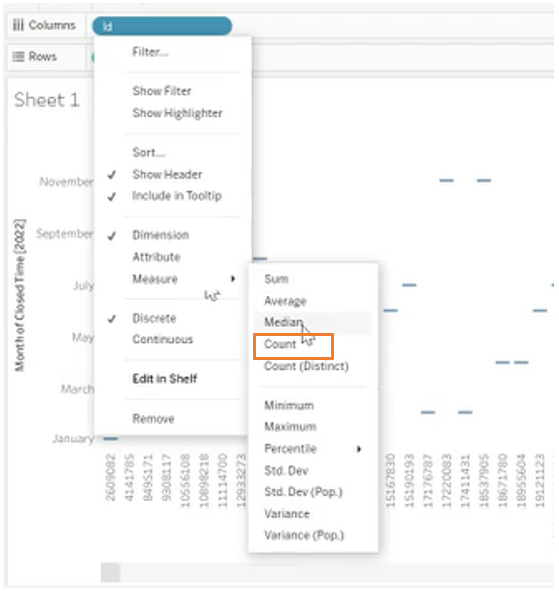
Select the 2nd component and place it in the Columns or Rows. For our example, we want to know How many conversations were closed, so we choose Id. (Every conversation has a unique id.)
-
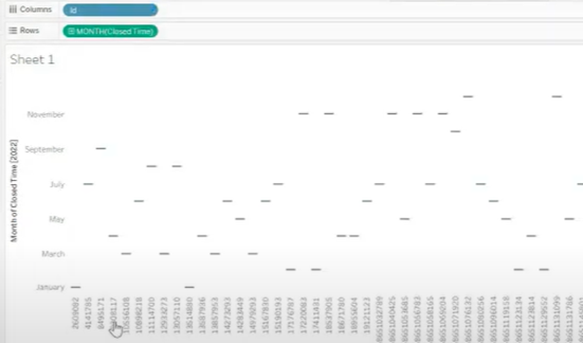
Change the presentation of the data by clicking on the component in the columns section. In our example, we choose Count because we want to know how many conversations were every month – not their specific Id.
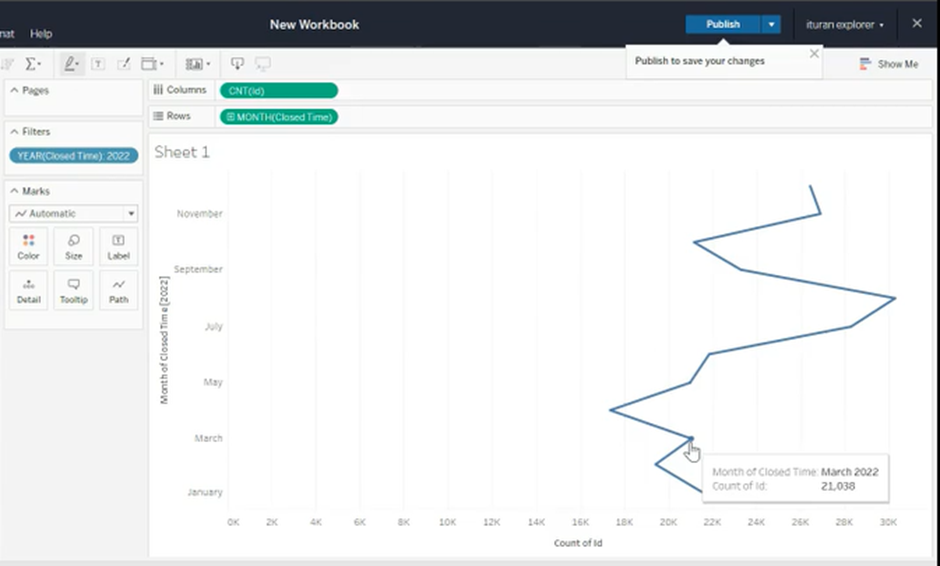
The created KPI shows how many conversations were closed during 2022 (per month)
-
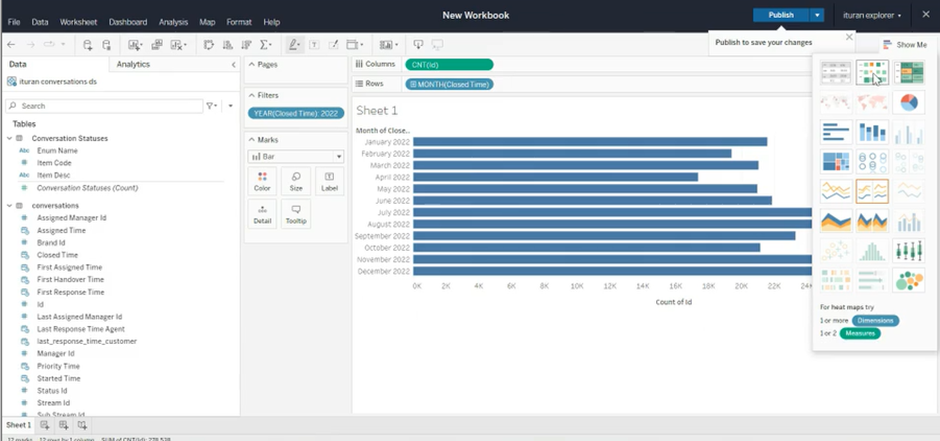
At the top right corner, click the Show Me button to open a display menu for the newly formed KPI.
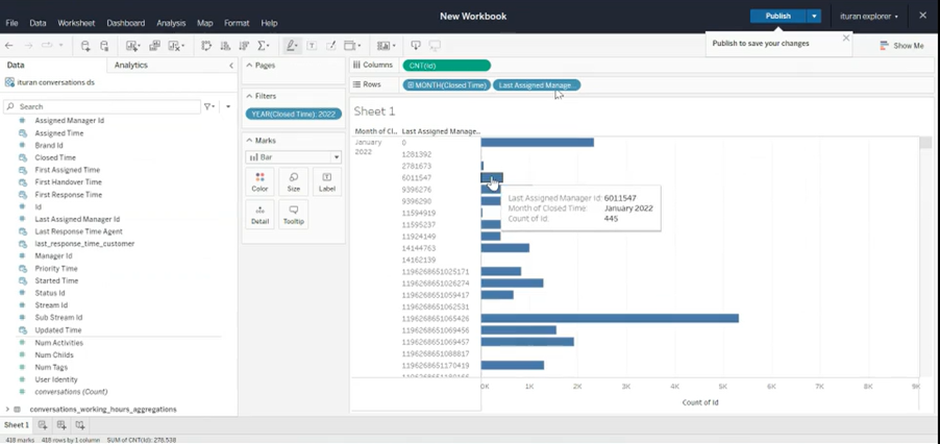
Note: you may add additional parameters to the KPI by dragging them to the Rows or Columns areas. For example, by adding to the Rows the “Last assigned manager Id” field, the conversations will be presented for each month per manager.
-
At the top of the screen, Publish the new table.
When publishing the first KPI, name the Workbook (Folder). Once the workbook is created, you can rename the sheets’ names at the title or at the tabs at the bottom of the screen.
Creating a New Dashboard
-
At the bottom left section, click the New Dashboard icon.
-
Select each KPI from the left pane and drag it to the desired location in the main area.
-
Click Publish.
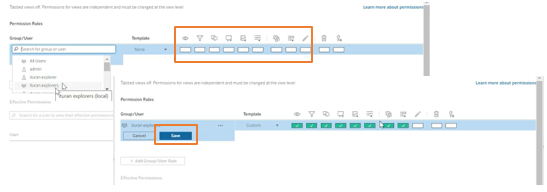
Establishing Permissions
- At the left pane of the opening screen, click Explore, and open the business account folder.
- Select the folder you would like to connect to CommBox. Note that the folder contains both the Dashboard and the included KPIs.
- Click the 3-dot menu under the Dashboard, followed by Permissions.
- Click the + Add Group / User Rule button and select the group of users that will gain access to the dashboard.
- Click the permissions for the selected group (we recommend the first eight) to turn them on and click Save.