Overview
The Tags Dashboard enables admins and team leaders with BI credentials to gain insight into tag usage within the organization. Besides listing all the tagged conversations and their tags, tags are also cross-referenced by a common string value, origin, and other tags with possible association. Tagged conversations are also segregated by bot and agent closings.
Hovering on any section shows a detailed explanation for the relevant selection.
Clicking on any section shows the related Conversation IDs of that selection.
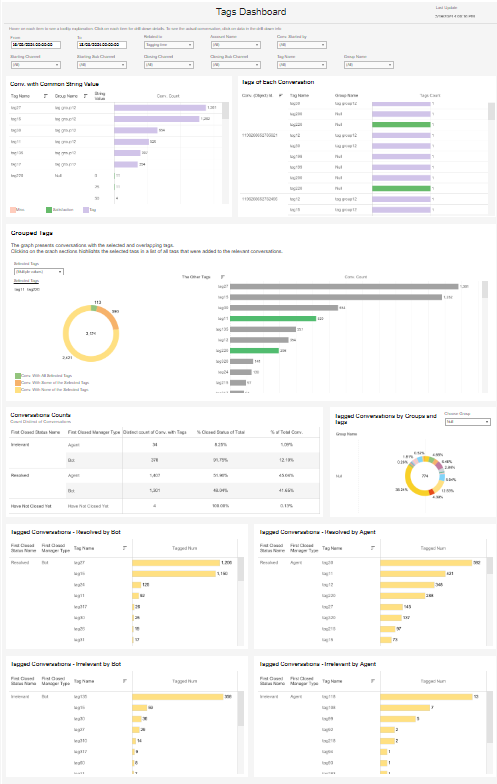
This guide explains each section of the board and how to export the data while pointing to relevant examples that can be learned from the presented data.
To access the board, navigate to Insights > Custom BI Dashboards and select the Tags Dashboard from the dropdown menu.
Note that BI Dashboards require specific permissions. Contact us for more information.
Selecting Data

- Select the date range of the search. Note the last available update at the top corner of the screen.
- Select between displaying the time the tag was added or the time the conversation started.
- Select the related account (brands) that will be reflected.
- Select to include conversations that started with a bot, an agent, or both.
- Limit the information by selecting specific routing channels and subchannels, specific tags, or groups of tags.
Conversations with a Common String Value
This section lists the number of conversations that have tags with the same string value.
The most common application is satisfaction tags. In the example below, 57 conversations had tag220 with a score of 100.
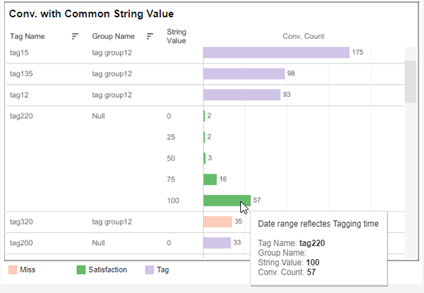
You can see the agents who issued these tags and their conversation IDs by clicking on the green bar.

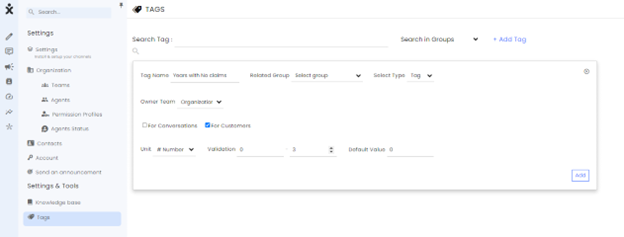
Set the string value when creating a tag at the Settings page in the Tags section.
Tags of Each Conversation
Lists each conversation with its issued tags.
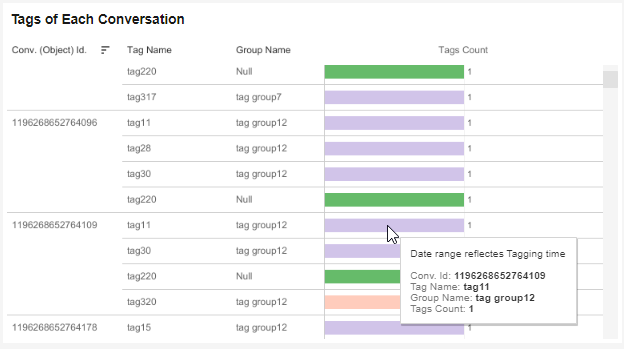
Clicking on the bar opens the conversation’s details.

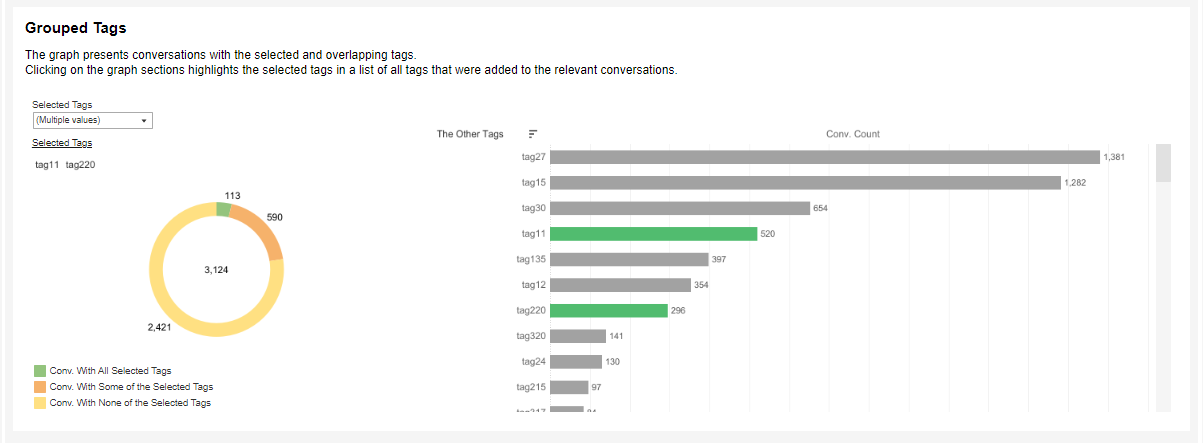
Conversations with Overlapping Tags
In this section, you can select specific tags to examine possible correlations.
The Pie diagram displays the percentage of the conversations that have all the chosen tags, some of the selected tags, or none of them.
The bars next to the pie show all the tags that appeared in conversations that had one or more of the selected tags.
Click on any part of the pie to highlight the relevant tags.
- Clicking the green section, the conversations with Tag11 and Tag220 will be highlighted.
- Clicking the orange section will highlight conversations with just tag11 and just tag220. When more tags are selected, the orange color includes all conversations with some but not all of the selected tags.
- Clicking the yellow section will highlight those conversations that have none of the selected tags.
Conversation Counts
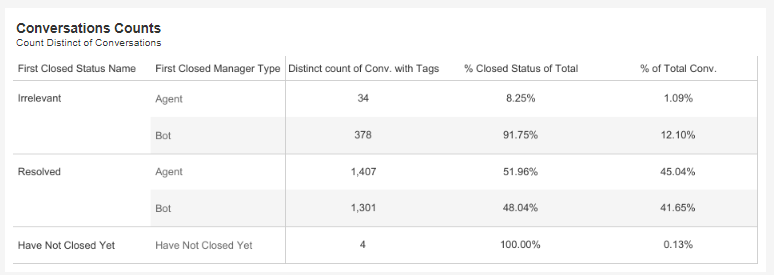
This section counts conversations with tags by their closing status and closing entity (bot/agent).
See below for details.
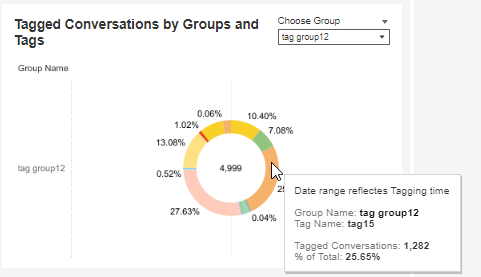
Tagged Conversations by Group of Tags
Tags can be grouped together to ease their management. This section zeros in on tagged conversations where the tags belong to a specific group. The null options refer to all tags that don’t belong to a specific group.
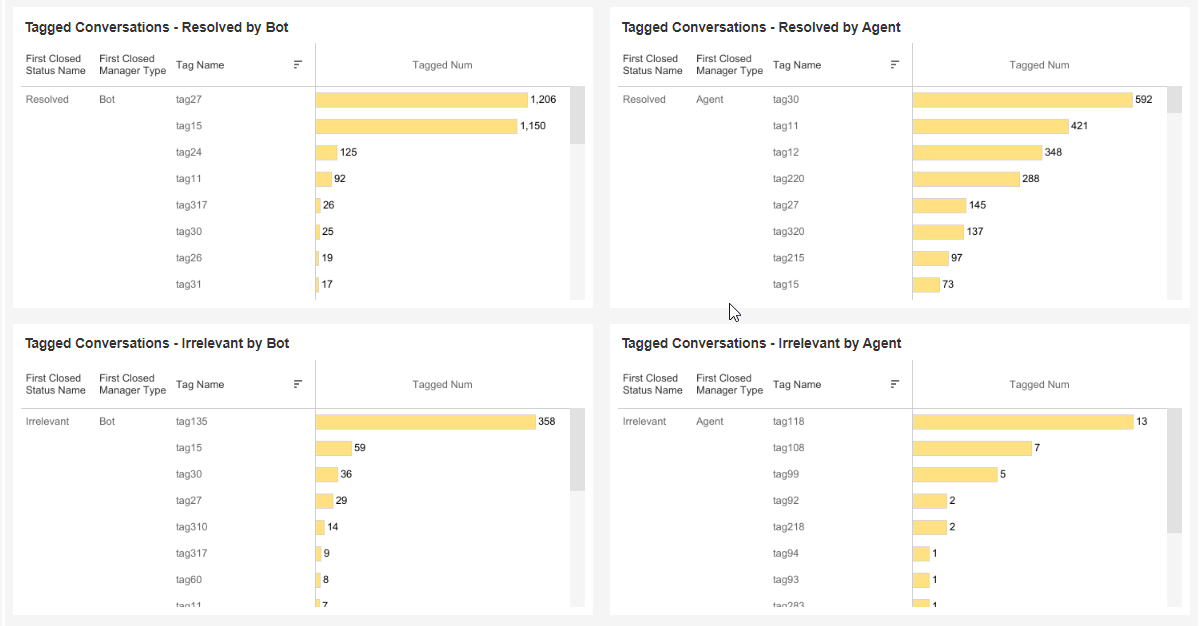
Conversation Counts - Details
Detailed account of the above-mentioned table. Shows which tags were used and in how many conversations.
To see the issuing of tags listed by the agent, see the BI Agent Board.
