Overview
CommBox Insights empowers team leaders and administrators to analyze system data within specified time frames, providing valuable insights into conversations, agent performance, productivity, and customer engagement and satisfaction.
This guide details each section's attributes and demonstrates how to effectively utilize various features to present data in a clear and actionable format. Except for the Overview, all sections offer the option to download information into an Excel file by clicking the Export button in the screen's top corner. We recommend using this tool for in-depth analysis and cross-referencing.
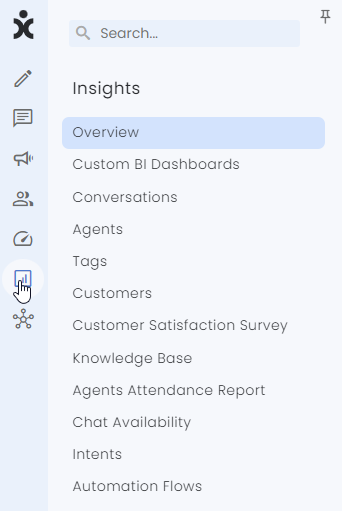
To access the Insights hub, navigate to the main sidebar menu and click the seventh icon from the top. The initial page provides an overview of all Insights boards, except for Custom BI Dashboards, which require special permissions.
Specific permissions are needed to enable the agents to see the Insights section.
Click here to learn more about granting permissions and permission profiles.
Overview Section
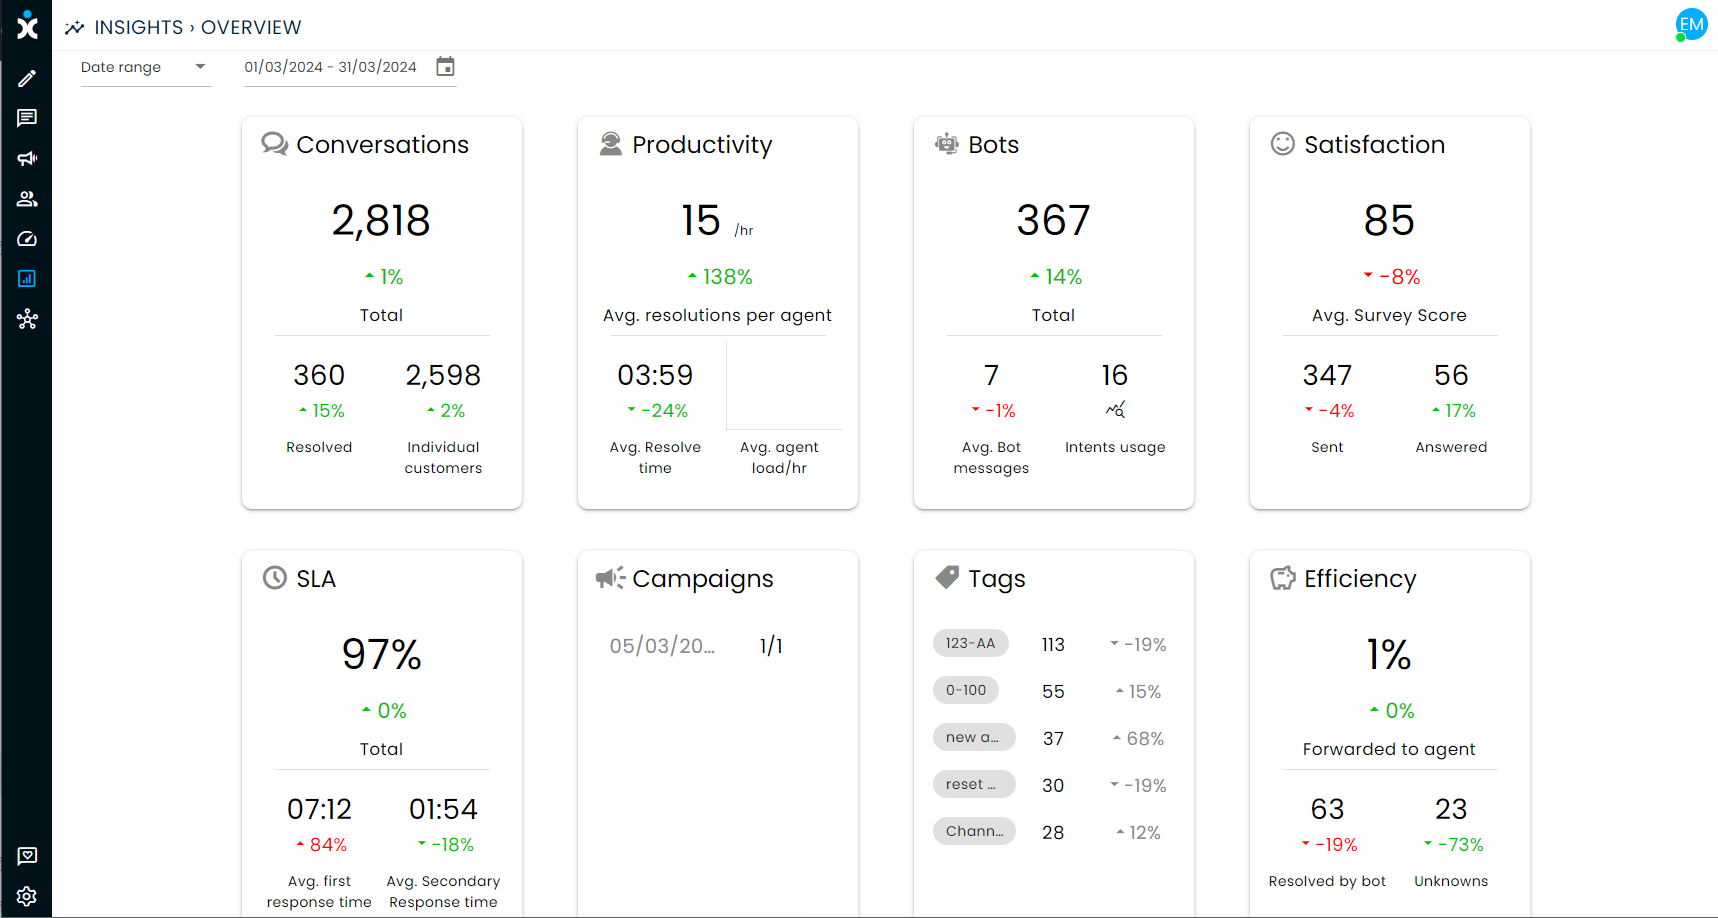
The Overview section provides a centralized summary of the most critical operations, displaying leading campaigns and the most frequently used tags. It offers a quick snapshot of organizational activities within the selected time range. The data is aggregated from conversations across all active channels involving agents and bots.
To begin, select the desired date range from the top corner. Please note that when choosing "Today," some KPIs may experience a delay of up to an hour.
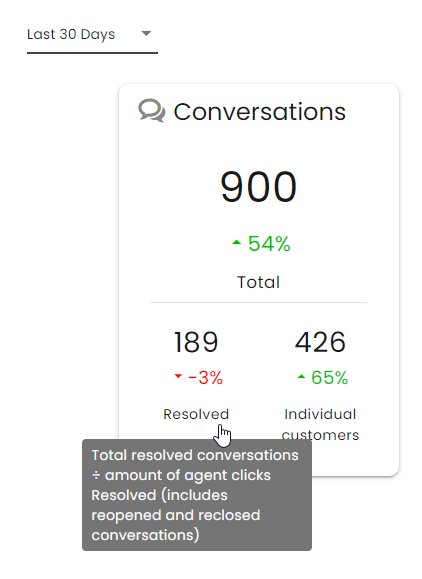
Each tile presents data along with a percentage comparison to the previous period (the same number of days prior to the current selection). An accompanying arrow indicates whether the change is positive or negative: green for improvement and red for decline. For example, a red upward arrow will indicate a higher number of SLA breaches.
Hovering over any KPI will display a tooltip explaining how the figure is calculated.
The eight tiles correspond to information available on various Insights boards. Clicking on a tile will direct you to the following boards:
- Conversations → Conversation Board
- Productivity → Agents Board
- Bots → Automation Board
- Satisfaction → Customer Satisfaction Survey Board
- SLA → Conversation Board (SLA details can be found under the agents listed)
- Campaigns → Campaigns Hub in the main sidebar menu
- Tags → Tags Board
- Efficiency → Automation Board
Important to Note:
The Overview includes data from both synchronous and asynchronous channels. As such, metrics like SLA represent only a general overview rather than channel-specific details.
Conversations
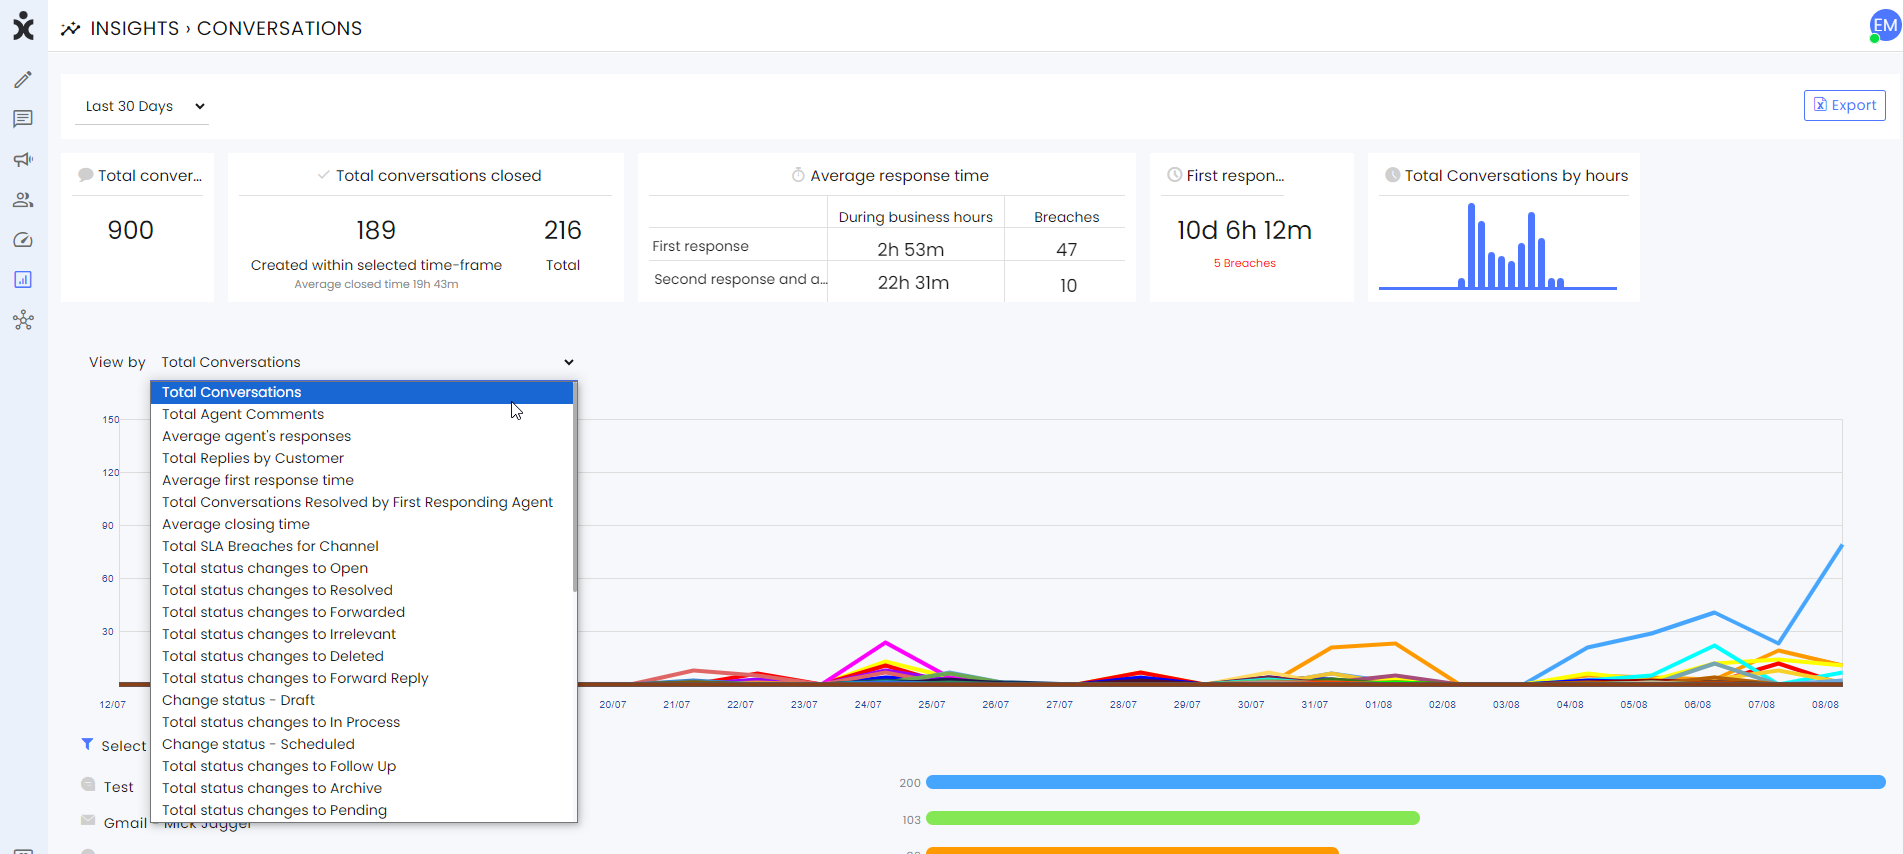
The Conversation Insights board provides aggregated data on conversations across all active channels.
The board's key performance indicators (KPIs) include:
- Total Conversations: Reflects the total number of conversations for the selected period, encompassing both incoming and outgoing traffic.
- Total Conversations Closed: This represents the total number of conversations initiated and concluded within the selected time frame, as well as those that began before the period and closed within it.
- Average Response Time: Displays the average first and second response times during business hours, along with the number of SLA breaches. The time measured excludes the duration when the customer interacted with a bot earlier in the conversation.
- First Response: Measures the average time from an agent's assignment to their first response, including the number of SLA breaches during this period.
- Total Conversations by Hour: This shows the number of conversations initiated each hour during the selected time frame.
Bottom Display:
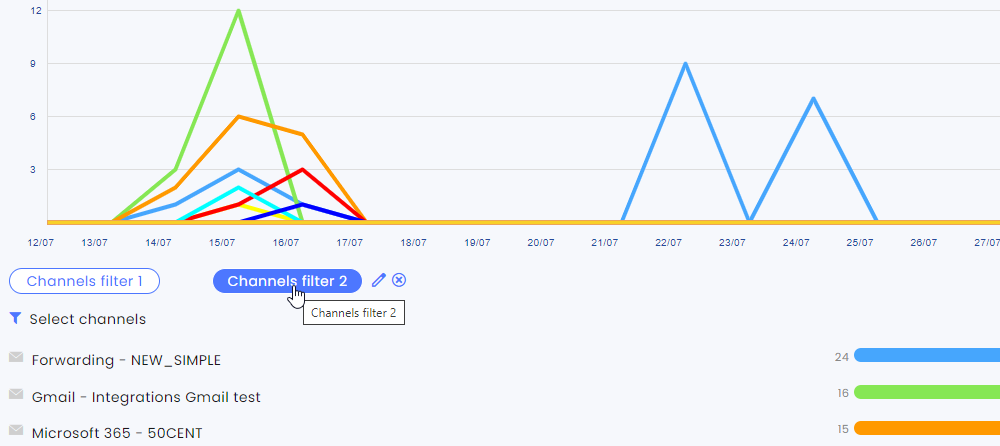
Each graph option visualizes the selected data, segmented by different communication channels, with each channel represented by a distinct color.
To narrow the display to specific channels, click the filter icon below the graph and select the channels you wish to include. Inactive channels will appear grayed out and cannot be selected.
You can edit the filter by clicking the pencil icon or remove it by clicking the “X.” Once applied, the top KPIs will also reflect the selected channels, providing a more precise view of customer experiences.
Important to Note:
- The selected time range cannot exceed one month (or 30 consecutive days).
- For optimal insights into agent productivity, we strongly recommend that all conversations be assigned either automatically via the auto-assign module or manually by agents.
- The Total Conversations index tracks conversations that originated in each channel, excluding those transferred from other channels. To view the total number of conversations on each channel, including transfers, refer to the "Total Conversations Added to the Channel" index. This distinction is particularly relevant when conversations initiated by a bot in Channel A are later handled by an agent in Channel B.
- The data in the Excel report is organized per channel.
Agents
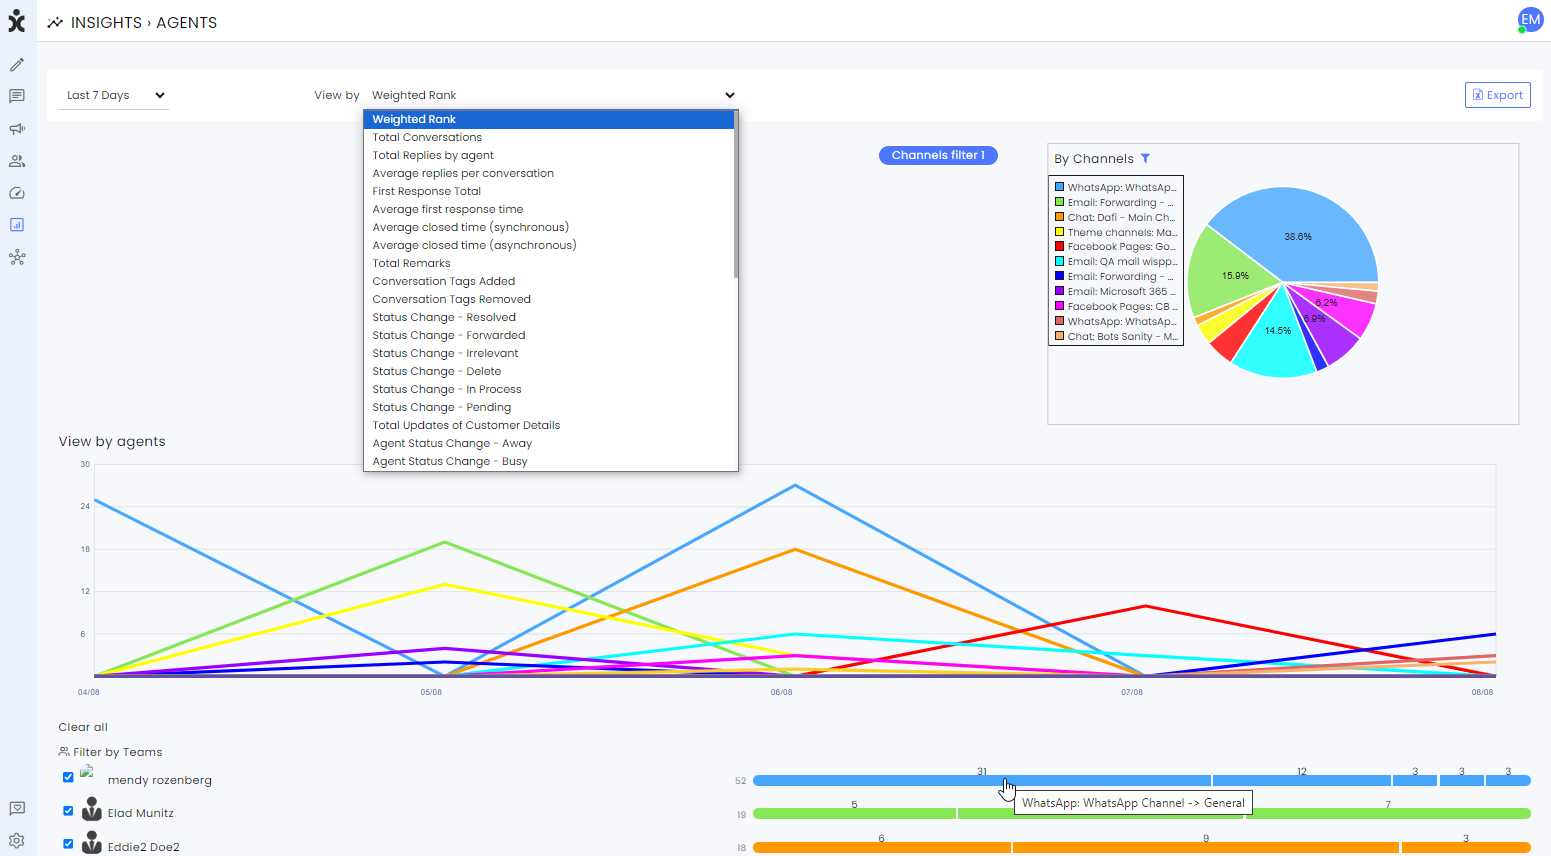
This section provides insights into agent activity across all channels in which they were active. By selecting specific channels, you can focus on activity within those channels.
Top Filter:
The top filter displays all channels included in the analysis. Click the filter icon to create a custom filter, which will limit the displayed channels accordingly. When applied, the section below will show only the agents active in the selected channels.
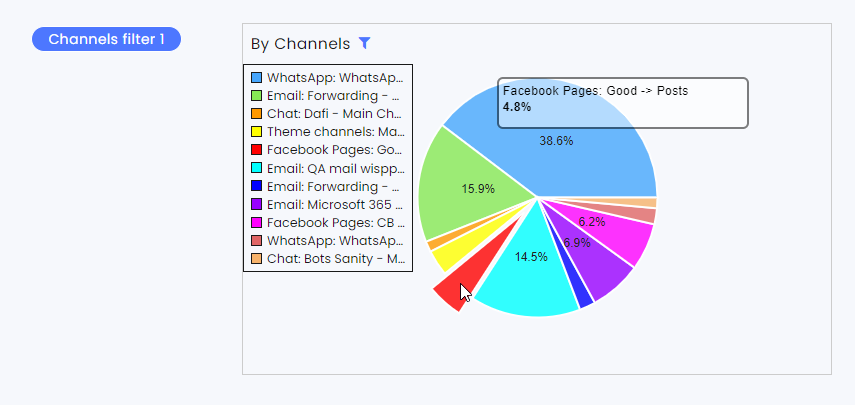
Hovering over a pie chart segment reveals details about the communication channel, including its type, name, sub-channel name, and the percentage of conversations within that channel.
Choose the data type you wish to analyze, such as Total Conversations or Total Replies by the Agent. The pie chart at the top will then display the channels associated with the selected actions (based on the filtered channels).
Bottom Display
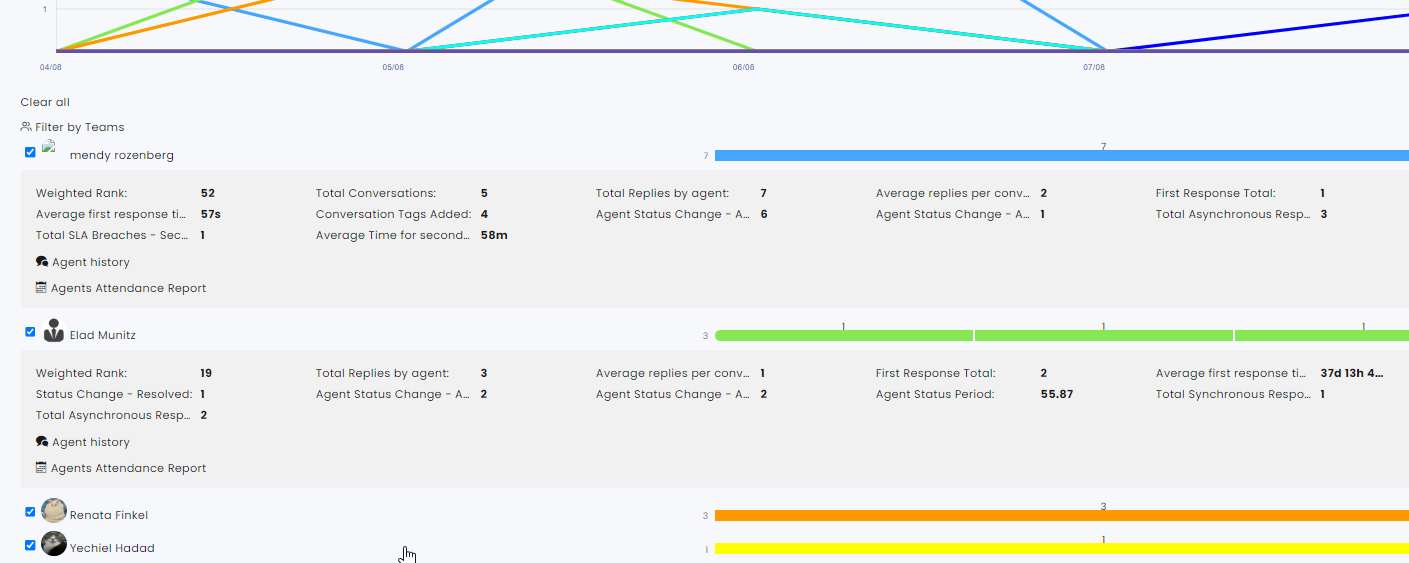
The total activities for each agent listed are shown and segmented by the channel in which they occurred. Click on an agent to view their detailed statistics.
Important to Note:
-
You can filter agents by Teams by clicking the Teams filter at the top of the agent list.
-
Each line representing a channel for an agent is divided to show different channels or sub-channels used. For example, if you select "Conversations Resolved by Agents" and filter for WhatsApp channels only, hovering over each section will display the name of the sub-channel.
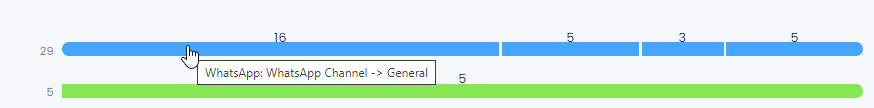
-
In the Excel report, each day of the selected time frame is listed with activity details for every active agent. Each channel used by an agent is recorded on a separate line, and the Summary tab provides a daily overview of all agents.
Tags
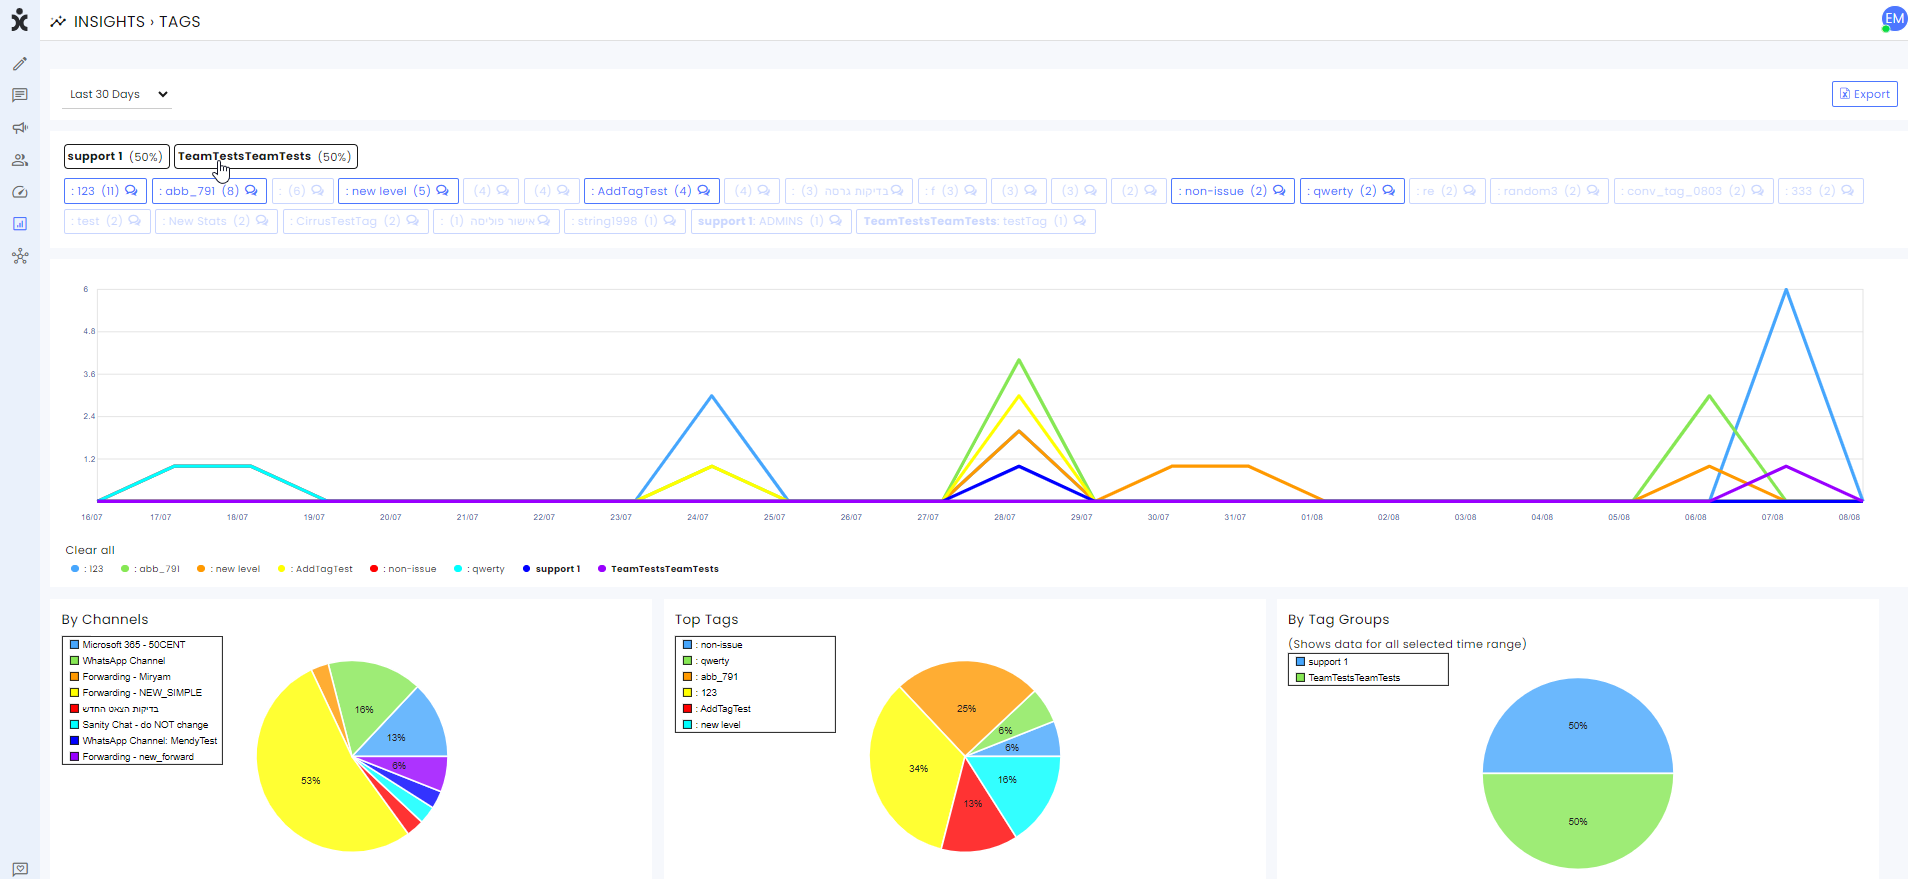
The Tags section enables team leaders and managers to track the usage of various tags within the team or the organization.
All tags used by the organization during the selected time frame are listed. The black items at the top represent groups of tags with percentages of use. Below them, in purple, are the tags themselves with the number of times the tag was used during the selected time frame. When a tag belongs to a group, the group’s name is also listed within the item.
Bottom display:
After selecting the tags, the bottom display shows the channels used when the tags were added, the top tags from the selected list (when there are many selected tags), and the group of tags that were used.
Important to note:
When all the group's tags percentages don’t add up to 100%, it means there were other tags not in a group that were used.
Customers
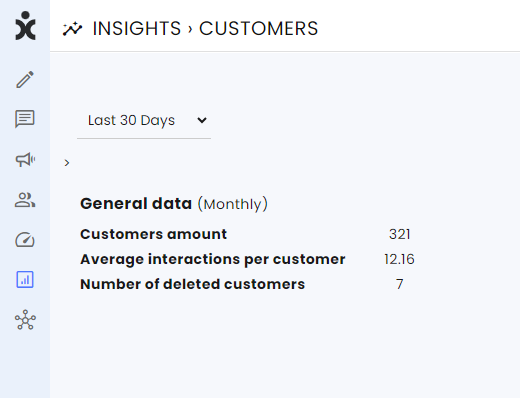
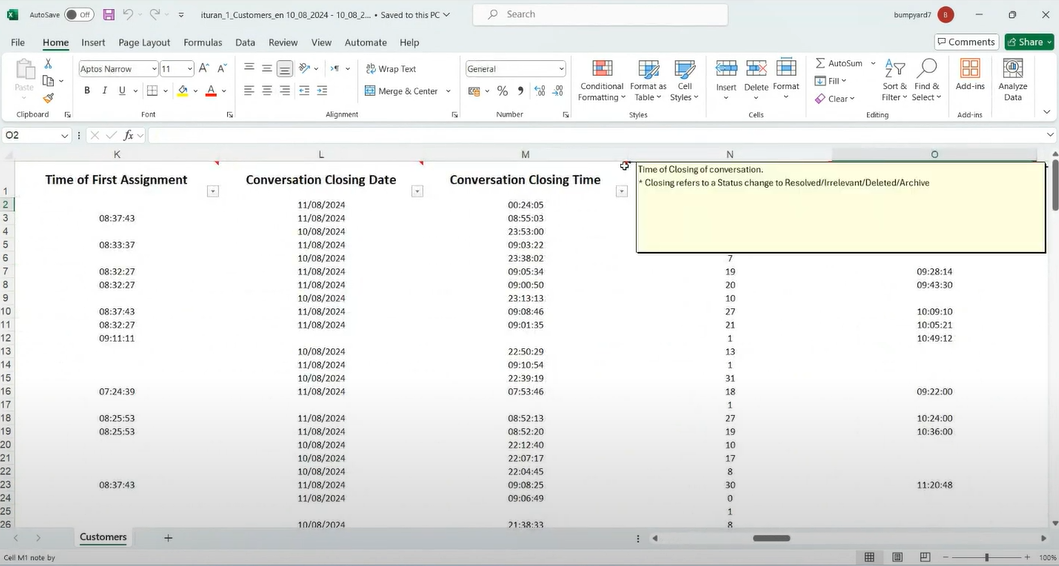
This section offers comprehensive data on customers and conversations. Due to the volume of information, the selected time range is limited to a maximum of 30 days. Exporting the data to an Excel file will maximize its utility and facilitate detailed analysis.
Important to Note:
- The Excel file has a tooltip for each column (when enabled) explaining what is being displayed. This should help to cross-reference the different columns based on the topic being investigated.
- Every line in the report represents a different conversation with a customer.
Customer Satisfaction Survey
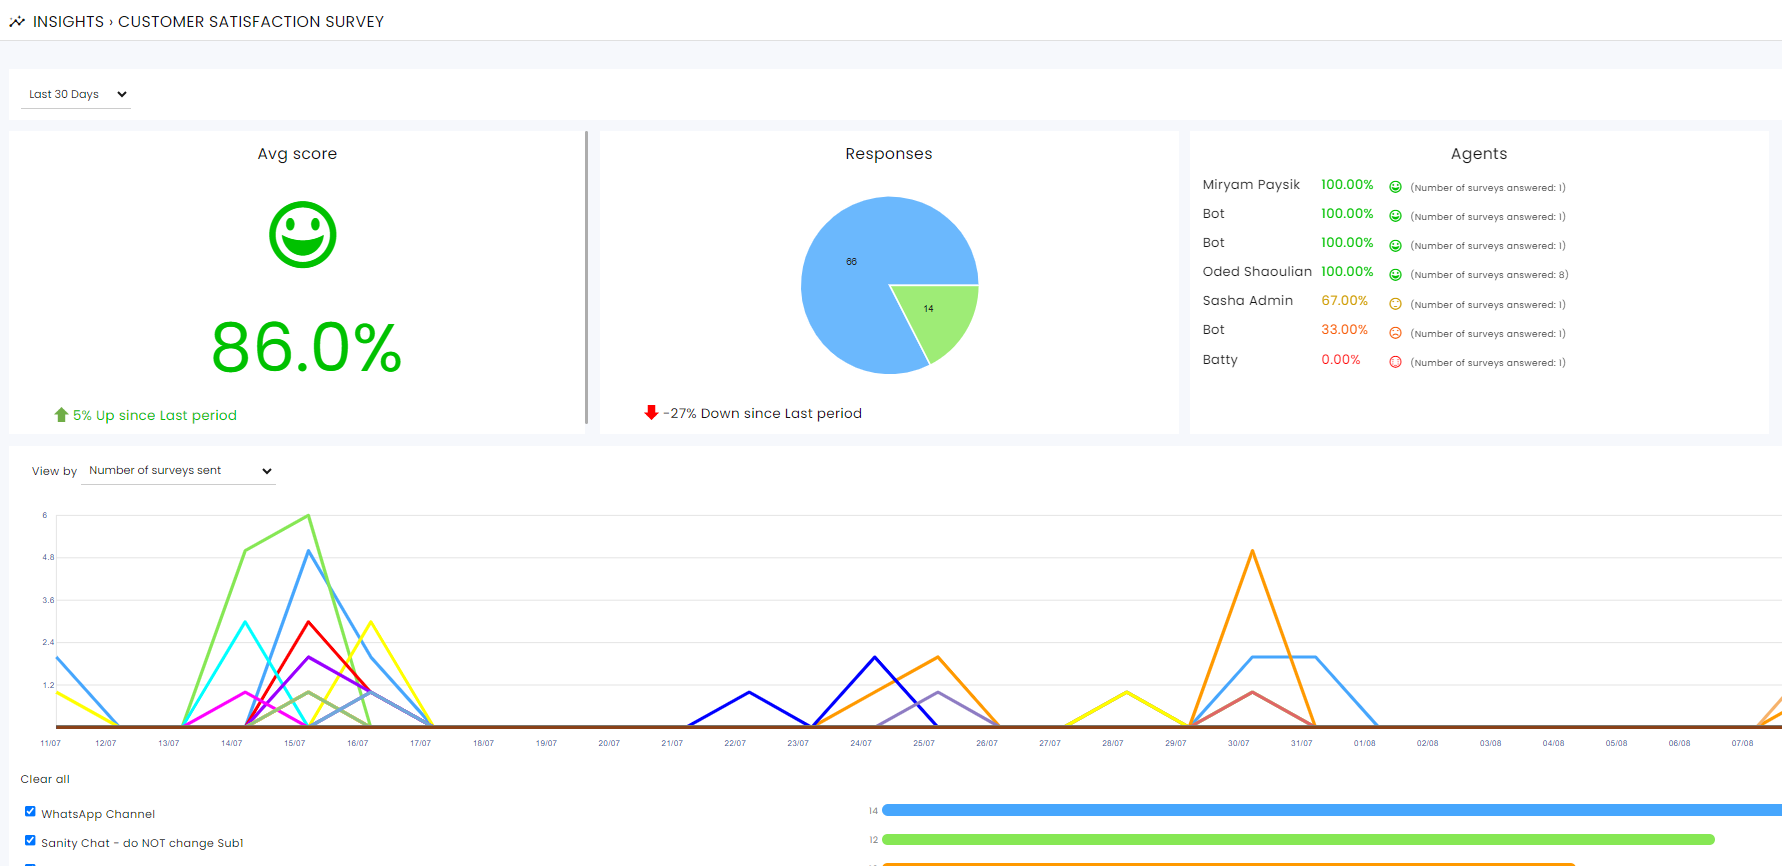
Agents have the option to send a customer satisfaction survey at the end of each conversation. The system tracks when surveys are sent and the scores of completed surveys. Please note that responses to open-ended questions are not included in the report.
Top KPIs include:
- Average Score: The average rating for all surveys across all channels.
- Responses: The total number of surveys sent by agents and the number that were completed.
- Agents: Displays agents with completed surveys along with their average scores.
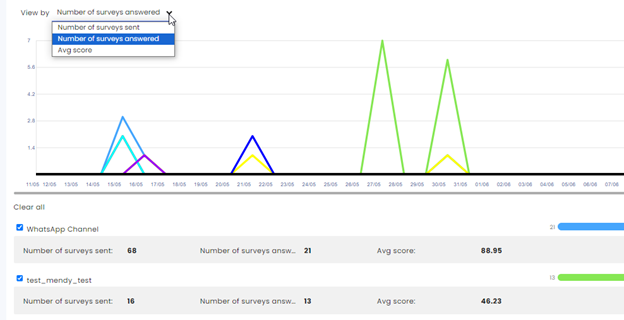
Bottom Display:
The graph visualizes survey data by channel, highlighting:
- Channels sending the most surveys
- Channels receiving the most responses
- Channels achieving the highest scores
Important to note:
Survey information about a specific agent can be found in the Agent report.
Knowledge Base
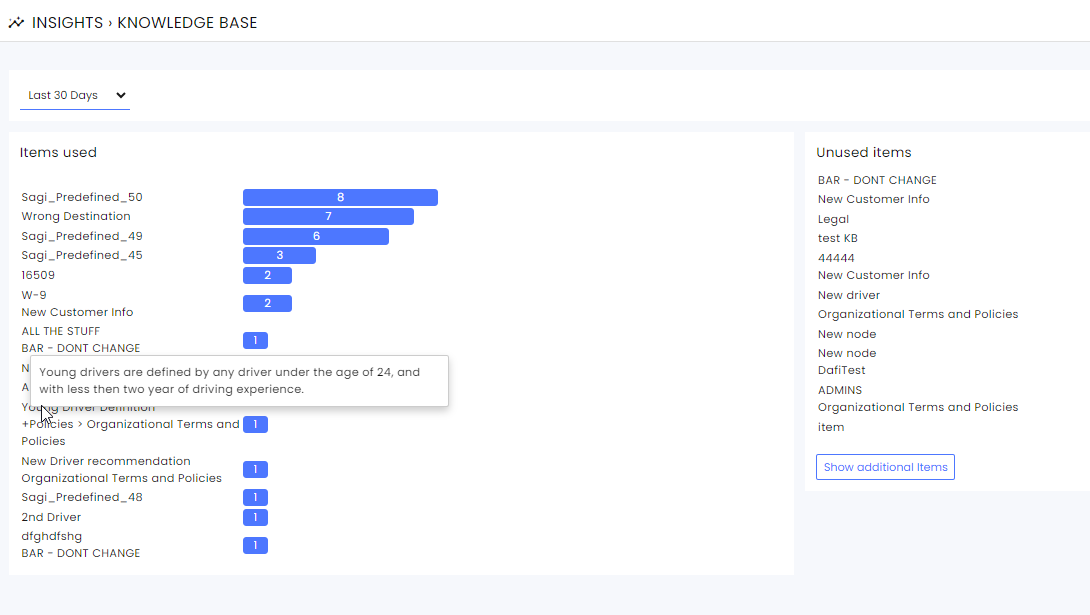
This section lists items used by the agents and those not used at all during the selected time frame. This should lead to continuous updating or deletion of knowledge base items.
Important to note:
Hovering over the item will show its content.
Agent Attendance Report
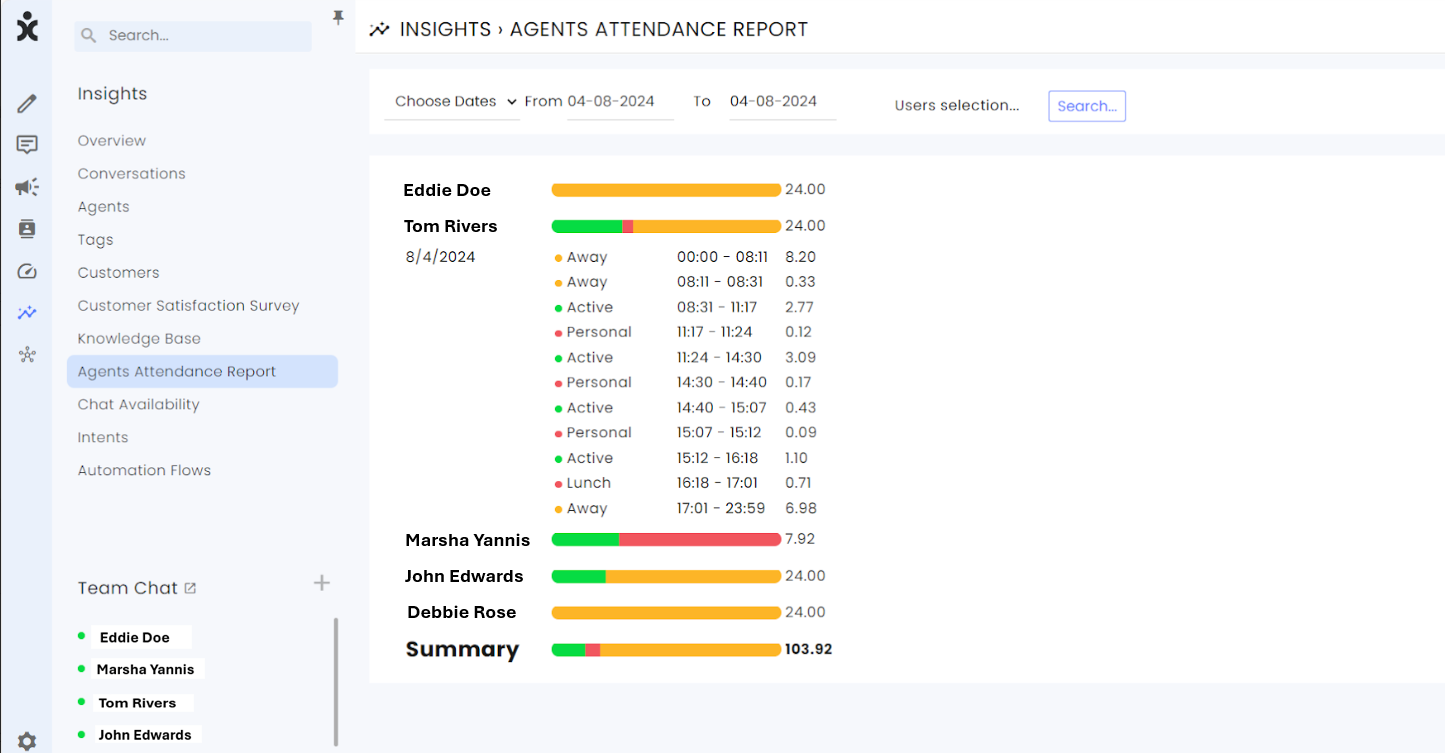
The Agent Attendance Report shows the breakdown of selected agent’s statuses in the time frame selected.
Select the time frame you want to investigate and the relevant agents.
Important to note:
Hovering over the bar next to the agent’s name shows how many hours the agent was in each of the statuses.
Click here to learn more about Agents Statuses.
Chat Availability
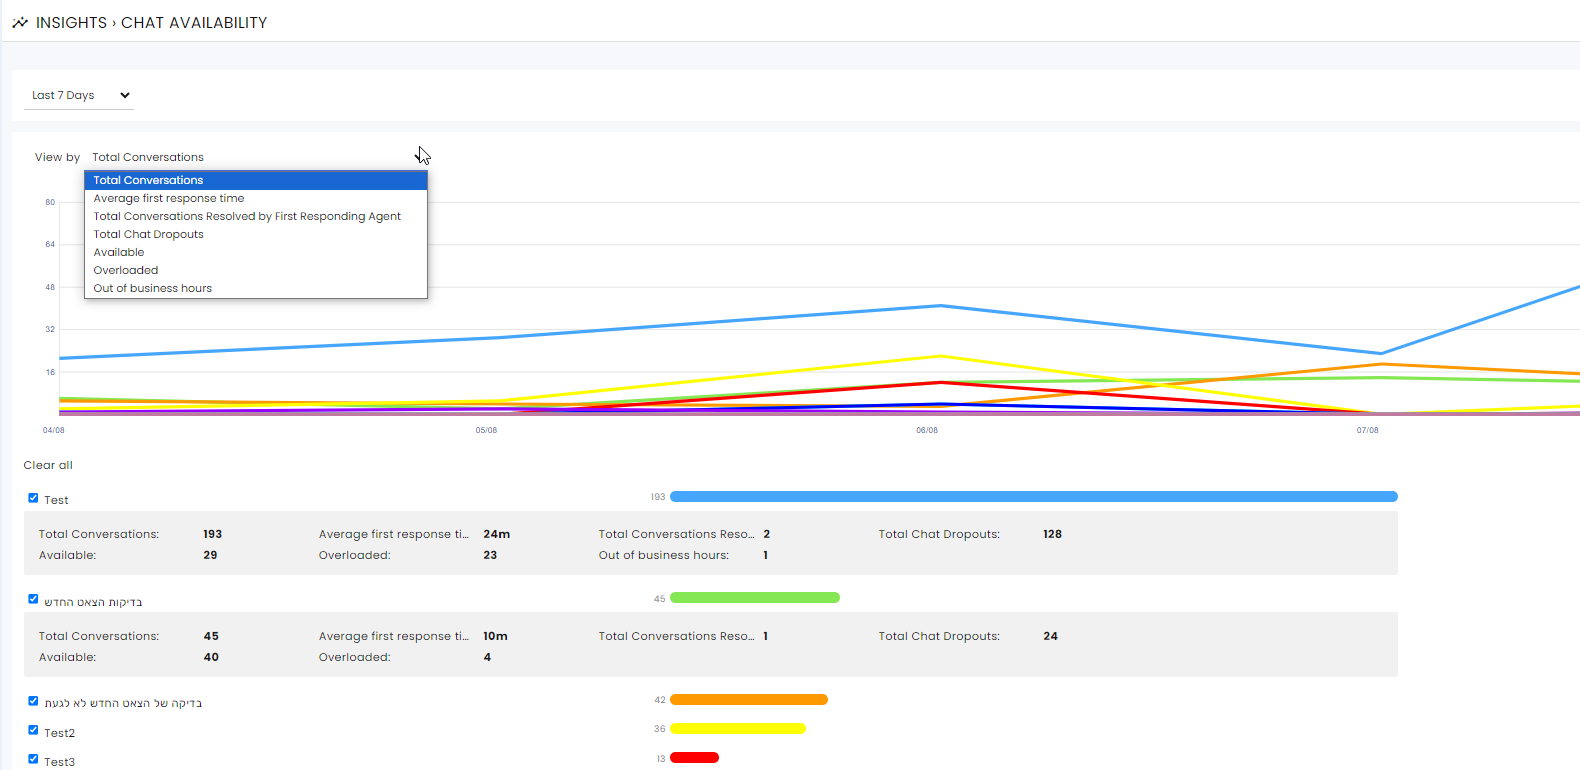
Organizations with Chat channels can see information unique to chat conversations.
- Drop-out reports show how many customers left the conversation before receiving the first response.
- Availability report shows times when there were no available active agents in the specific channel or when all agents served the allotted number of customers based on the auto-assign module.
Intents
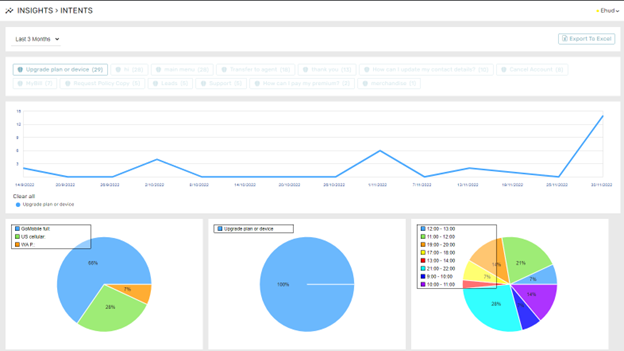
The Intents module contains sentences and keywords that the system recognizes as a customer's desire or request. Once identified, the intent can lead to a specific stage within the flow of the bot or an agent suggesting a service or a product. The Intents can be attached to a bot script or operate alongside an agent and provide insight into customers’ wishes.
The Intents tab of the Insights module can be used to track the frequency of various Intents within the brand. In the Overview section, under the Bot segment, you can see the total intents discovered by the system.
Automation Flows
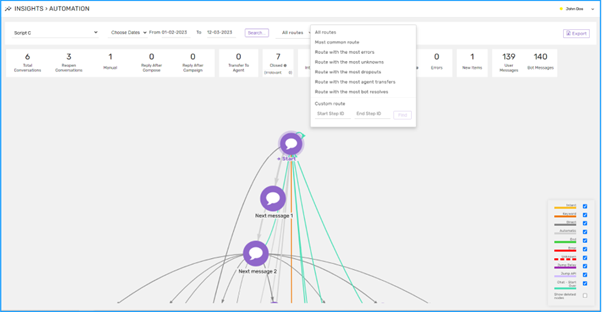
The Automation Flows delves into the bot’s performance to enable admins to view the customer’s actual experience within the bot.
Click here for the dedicated guide for this section.